QRS complex

|
WikiDoc Resources for QRS complex |
|
Articles |
|---|
|
Most recent articles on QRS complex Most cited articles on QRS complex |
|
Media |
|
Powerpoint slides on QRS complex |
|
Evidence Based Medicine |
|
Clinical Trials |
|
Ongoing Trials on QRS complex at Clinical Trials.gov Clinical Trials on QRS complex at Google
|
|
Guidelines / Policies / Govt |
|
US National Guidelines Clearinghouse on QRS complex
|
|
Books |
|
News |
|
Commentary |
|
Definitions |
|
Patient Resources / Community |
|
Patient resources on QRS complex Discussion groups on QRS complex Patient Handouts on QRS complex Directions to Hospitals Treating QRS complex Risk calculators and risk factors for QRS complex
|
|
Healthcare Provider Resources |
|
Causes & Risk Factors for QRS complex |
|
Continuing Medical Education (CME) |
|
International |
|
|
|
Business |
|
Experimental / Informatics |
Editor-In-Chief: C. Michael Gibson, M.S., M.D. [2]; Associate Editor-In-Chief: Cafer Zorkun, M.D., Ph.D. [3]
Synonyms and keywords: QRS interval
Overview
The QRS complex represents electrical activation of the ventricle. Widening of the QRS complex may reflect delayed conduction in the His, bundle branch or purkinje conduction system.
Morphology of the QRS Complex
Q Wave
If the first deflection of the QRS is downward, it’s called a Q wave. The Q wave represents activation of the ventricular septum. The electricity spreads from right to left through the septum.
Q waves may be normal. For example in lead I, a Q less than 1/4 of the R height, and less than one box wide, is considered normal. This is the early activation of the septum. This activation goes left — away from lead I — and is therefore negative on the ECG. “Septal Qs” are normal in I, F, V5 and V6. Qs are also generally innocent in lead III and lead V1 if no other abnormality is seen.
Q waves are “significant” if they are greater than 1 box in width (longer than 0.04 msec) OR are larger than 1/4 of the R wave.
Q waves can be seen on the electrocardiogram following necrosis of the myocardium such as seen in acute MI or the replacement of electrically active tissue with electrically inert tissue as seen with Chagas disease. A Q wave may also reflect septal hypertrophy in hypertrophic cardiomyopathy (HCM).
Pathological Q Wave
Pathological Q waves are defined as one of the following:[1]
- Q waves in leads V2 or V3 ≥ 0.02s
OR
- Q wave ≥ 0.1 mV in depth and ≥ 0.03 s in duration in at least two contiguous leads (I, aVL, V5, V6; V2, V3; V3, V4; or II, III, aVF)
OR
- R wave ≥ 0.04s and R/S ≥ 1 in V1 and V2 with a concordant positive T wave without any conduction defect
Causes of Q Waves in the Absence of Myocardial Infarction
- A QS complex in lead V1 is normal.
- A Q wave <0.03 s and <1/4 of the R wave amplitude in lead III is normal if the frontal QRS axis is between 30 and 0°.
- The Q wave may be normal in aVL if the frontal QRS axis is between 60 and 90°. Small septal Q waves are non pathological Q waves if <0.03 s and <1/4 of the R wave amplitude in leads I, aVL, aVF, and V4-V5-V6
- The following may be associated with Q/QS complexes in the absence of myocardial infarction:
- Chagas disease
- Hypertrophic cardiomyopathy
- Preexcitation syndromes
- Obstructive or dilated cardiomyopathy
- LBBB
- RBBB
- Left anterior fascicular block
- LVH
- RVH
- Myocarditis
- Acute cor pulmonale
- Hyperkalemia
Conditions that Mask Q waves in the Presence of Myocardial Infarction
The following may be associated with masking of the Q waves despite the presence of a myocardial infarction:
LBBB
- LBBB may mask or mimic the presence of Q waves and ST-T changes during the acute and late phases of ventricular depolarization[2]
- The sensitivity of Q wave abnormalities on EKG in ischemia among patients with complete LBBB is only 31%[2]
Ventricular Paced Rhythm (VPR)
- Ventricular pacing may alter EKG patterns of necrosis and result in abnormal QRS forces[3]
- VPR from the apical RV region may demonstrate a wide QRS complex or pseudo-Q waves[4]
- Ventricular fusion may result in pseudoinfarction pattern[4]
- The unmasking of early Q waves during MI may necessitate changing the position of the leads[4]
Wolff-Parkinson-White (WPW) Pattern/Syndrome
- Preexcitation and presence of delta waves typical of WPW syndrome or WPW pattern may either mimic acute and chronic MI or may mask it[5]
- Abolishment of delta waves may be necessary for the diagnosis of MI to be made on EKG[6]
- Left posterolateral or lateral accessory pathways may mask inferior or anteroseptal MI[7]
- Posteroseptal accessory pathways may mask an anterior MI[7]
- Right anteroseptal and anterolateral accessory pathways may mask inferior or anterolateral MI[7]
EKG Changes of Prior Myocardial Infarction
- Any Q wave in V2-V3 ≥0.02 sec or presence of QS complex in V2 and V3.
- Q wave ≥0.03 sec and ≥0.1 mV deep or presence of QS complexes in leads I, II, aVL, aVF or V4-V5-V6 in any two leads of a contiguous lead grouping (I, aVL, V6; V4-V5-V6, II, III and aVF). The same criteria are used for supplemental leads V7-V8-V9, and for the Cabrera frontal plane leads.
- R wave ≥0.04 sec in V1-V2 and R/S >1 with a concordant positive T wave in the absence of a conduction defect.[8]
R wave
The first upward deflection of the QRS is called the R wave. Most of the ventricle is activated during the R wave. The R wave may be prolonged if the ventricle is enlarged, and may be abnormally high (indicating strong voltage) if the ventricular muscle tissue is hypertrophied.
Looking at the precordial leads, the r wave usually progresses from showing a rS-type complex in V1 with an increasing R and a decreasing S wave when moving towards the left side. There is usually an qR-type of complex in V5 and V6 with the R-wave amplitude usually taller in V5 than in V6. It is normal to have a narrow QS and rSr' patterns in V1, and so is also the case for qRs and R patterns in V5 and V6. The transition zone is where the QRS complex changes from predominately negative to predominately positive (R/S ratio becoming >1), and this usually occurs at V3 or V4. It is normal to have the transition zone at V2 (called "early transition"), and at V5 (called "delayed transition").[9]
The definition of poor R wave progression (PRWP) varies in the literature, but a common one is when the R wave is less than 2–4 mm in leads V3 or V4 and/or there is presence of a reversed R wave progression, which is defined as R in V4 < R in V3 or R in V3 < R in V2 or R in V2 < R in V1, or any combination of these.[9] Poor R wave progression is commonly attributed to anterior myocardial infarction, but it may also be caused by left bundle branch block, Wolff–Parkinson–White syndrome, right and left ventricular hypertrophy as well as by faulty ECG recording technique.[9]
Shown below is an EKG demonstrating poor R wave progression:

Tall R waves in V1
Examples
-
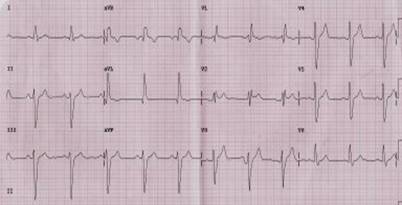
Tall r waves in V1
-
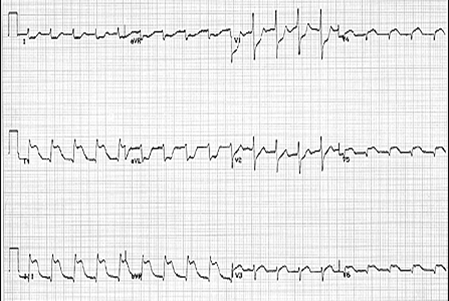
Tall R waves in V1


Causes of tall R waves in V1
- Posterior MI
- RBBB
- Right Strain
- PE
- COPD
- Cor Pulmonale
- RBBB mimics
- PE
- Brugada
- ARVD
- WPW
- Pediatric EKG (tall R-wave and flipped t-wave V1-3)
S wave
The S wave is any downward deflection following the R wave. Like the R wave, an abnormally large S wave may indicate hypertrophy of the ventricle.
If a second upward deflection is seen, it’s called an R-prime wave. R-prime waves are never normal, but indicate a problem in the ventricular conduction system.
QRS complexes may be described by naming the waves that form them. For example, a complex with an R, an S, and an R’ is called an RSR’ complex.
QRS Duration
- The normal duration is less than 0.12 seconds
- If the duation is > 0.12 seconds then either left bundle branch block (LBBB), right bundle branch block (RBBB) or a non-specific intraventricular conduction delay is present.
- The precordial leads are approximately 0.01 or 0.02 seconds longer than the limb leads.
Causes of a Wide QRS Interval or a Prolonged QRS Interval
- Hypothermia
- Incomplete left bundle branch block
- Incomplete right bundle branch block
- Left anterior fascicular block
- Left bundle branch block
- Left posterior fascicular block
- Non-specific intraventricular conduction delay (NSIVCD) (when the QRS is wide and the definitions of LBBB and RBBB are not met)
- Right bundle branch block
- Ventricular tachycardia
QRS Amplitude
Definitions of Low QRS Voltage:
- If the total amplitude above and below the isoelectric line is < 5 mm in all 3 standard leads.
- An average voltage in the limb leads of < 5 mm with an average of < 10 mm in the chest leads.
- Should be at least 5 mm in V1 and V6 , 7 mm in V2 and V5 and 9 mm in V3 and V4.

Pathophysiology of Low QRS Voltage
Three general processes contribute to low QRS voltage:
- Damping of the electrical signal due to excess air (emphysema, COPD), fluid (pericardial effusion, pericardial constriction, pleural effusion), edema (anasarca), fat (obesity), physiologic variant, or amyloid cardiomyopathy
- Electrically inert myocardium due to a loss of viable myocardium such as in myocardial infarction and Chagas disease]]
- Infiltration of the myocardium (myxedematous, Chagas disease)
Causes of Low QRS Voltage
The presence of low voltage on the EKG should prompt an evaluation to rule out life threatening emergencies such as cardiac tamponade or a large pericardial effusion. These two diagnoses are suggested by the presence of tachycardia and electrical alternans along with the low QRS voltage. In alphabetical order the differential diagnosis includes[10]:
- Alcoholic cardiomyopathy
- Amyloidosis
- Anasarca[11]
- Dilated cardiomyopathy[12]
- Beriberi heart disease
- Cardiomyopathy
- Chagas disease
- Diffuse coronary artery disease
- Congestive heart failure
- Constrictive pericarditis
- COPD
- Dilated cardiomyopathy
- Generalized edema and pedal edema[11]
- Emphysema
- Hemochromatosis
- Hypothermia
- Hypothyroidism
- Ischemic cardiomyopathy
- Prior myocardial infarction
- Myocarditis[13]
- Myxedema
- Obesity
- Pericardial effusion
- Pneumothorax
- Rejection after heart transplantation
- Restrictive cardiomyopathy
- Sarcoidosis
- Scleroderma
- Tamponade
- Technical error in the settings on the ECG apparatus (sensitivity should be at 10 mm/mV)
Definition of Maximal QRS Voltage:
Can be up to 20 to 30 mm in lead 2 and can be up to 25 to 30 mm in the precordial leads. [14] [15]
References
- ↑ Thygesen K, Alpert JS, White HD, Joint ESC/ACCF/AHA/WHF Task Force for the Redefinition of Myocardial Infarction. Jaffe AS, Apple FS; et al. (2007). "Universal definition of myocardial infarction". Circulation. 116 (22): 2634–53. doi:10.1161/CIRCULATIONAHA.107.187397. PMID 17951284.
- ↑ 2.0 2.1 Wackers FJ (1987). "The diagnosis of myocardial infarction in the presence of left bundle branch block". Cardiol Clin. 5 (3): 393–401. PMID 3690603.
- ↑ Sgarbossa EB, Pinski SL, Gates KB, Wagner GS (1996). "Early electrocardiographic diagnosis of acute myocardial infarction in the presence of ventricular paced rhythm. GUSTO-I investigators". Am J Cardiol. 77 (5): 423–4. PMID 8602576.
- ↑ 4.0 4.1 4.2 Barold SS, Herweg B, Curtis AB (2006). "Electrocardiographic diagnosis of myocardial infarction and ischemia during cardiac pacing". Cardiol Clin. 24 (3): 387–99, ix. doi:10.1016/j.ccl.2006.05.003. PMID 16939831.
- ↑ Smolders L, Majidi M, Krucoff MW, Crijns HJ, Wellens HJ, Gorgels AP (2008). "Preexcitation and myocardial infarction: conditions with confusing electrocardiographic manifestations". J Electrocardiol. 41 (6): 679–82. doi:10.1016/j.jelectrocard.2008.05.005. PMID 18602643.
- ↑ Liu R, Chang Q (2013). "The diagnosis of myocardial infarction in the Wolff-Parkinson-White syndrome". Int J Cardiol. 167 (3): 1083–4. doi:10.1016/j.ijcard.2012.10.055. PMID 23157811.
- ↑ 7.0 7.1 7.2 Preminger MW, Callans DJ, Gottlieb CD, Marchlinski FE (1994). "Radiofrequency catheter ablation used to unmask infarction Q waves in Wolff-Parkinson-White syndrome". Am Heart J. 128 (5): 1040–2. PMID 7942468.
- ↑ Thygesen K, Alpert JS, White HD (2007). "Task Force for the Redefinition of Myocardial Infarction. Universal definition of myocardial infarction Joint ESC/ACCF/AHA/WHF". Circulation. 2007: 2634–2653. PMID 17951284.
- ↑ 9.0 9.1 9.2 Poor R-Wave Progression. By: Ross MacKenzie, MD. J Insur Med 2005;37:58–62 [1]
- ↑ Madias JE. Low QRS voltage and its causes. J Electrocardiol. 41 (6): 498-500. doi:10.1016/j.jelectrocard.2008.06.021 - Pubmed citation
- ↑ 11.0 11.1 Madias JE (2008). "Low QRS voltage and its causes". J Electrocardiol. 41 (6): 498–500. doi:10.1016/j.jelectrocard.2008.06.021. PMID 18804788.
- ↑ Chinitz JS, Cooper JM, Verdino RJ (2008). "Electrocardiogram voltage discordance: interpretation of low QRS voltage only in the limb leads". J Electrocardiol. 41 (4): 281–6. doi:10.1016/j.jelectrocard.2007.12.001. PMID 18353352.
- ↑ http://www.google.com/url?sa=t&rct=j&q=&esrc=s&source=web&cd=1&cad=rja&ved=0CCYQFjAA&url=http%3A%2F%2Fwww.medschool.lsuhsc.edu%2Femergency_medicine%2Fdocs%2FTop%2520Ten%2520(or%252011)%2520EKG%2520Killers.ppt&ei=PXJeUJ0xp9rRAbOOgagK&usg=AFQjCNGGRSrJfRVl3cMy5au0lnmpeaBRQA
- ↑ Unverferth, Chest 1979: 75, 157.
- ↑ Hammill S. C. Electrocardiographic diagnoses: Criteria and definitions of abnormalities, Chapter 18, MAYO Clinic, Concise Textbook of Cardiology, 3rd edition, 2007 ISBN 0-8493-9057-5.
Examples
-
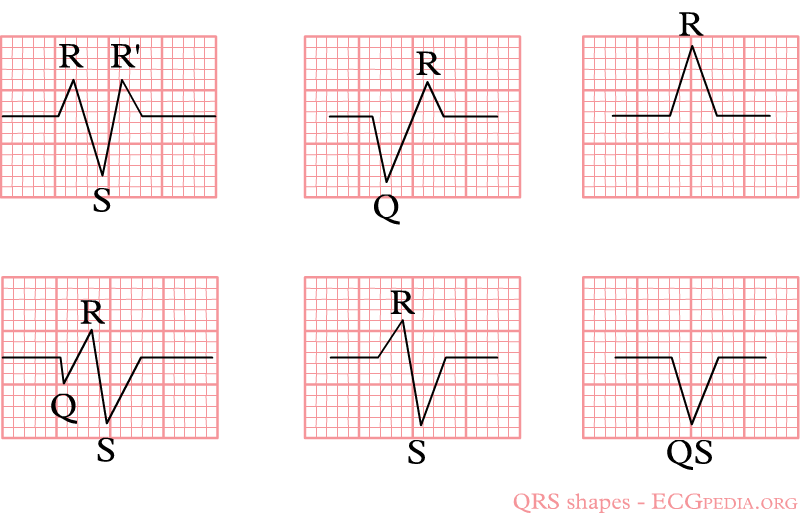
Diagram shows different types of QRS shapes
