T wave

|
WikiDoc Resources for T wave |
|
Articles |
|---|
|
Media |
|
Evidence Based Medicine |
|
Clinical Trials |
|
Ongoing Trials on T wave at Clinical Trials.gov Clinical Trials on T wave at Google
|
|
Guidelines / Policies / Govt |
|
US National Guidelines Clearinghouse on T wave
|
|
Books |
|
News |
|
Commentary |
|
Definitions |
|
Patient Resources / Community |
|
Directions to Hospitals Treating T wave Risk calculators and risk factors for T wave
|
|
Healthcare Provider Resources |
|
Continuing Medical Education (CME) |
|
International |
|
|
|
Business |
|
Experimental / Informatics |
Editor-In-Chief: C. Michael Gibson, M.S., M.D. [1]; Associate Editor(s)-In-Chief: Cafer Zorkun, M.D., Ph.D. [2] Prashanth Saddala M.B.B.S
Overview
The T wave represents the repolarization (or recovery) of the ventricles. The interval from the beginning of the QRS complex to the apex of the T wave is referred to as the absolute refractory period. The last half of the T wave is referred to as the relative refractory period (or vulnerable period).
Orientation of T waves
Normal Orientation
General
- Normally upright in leads 1 and 2 and in the chest leads over the left ventricle.
Precordial Leads
- Lead V1 may have a positive, negative, or biphasic T wave.
- The T wave in V1 may be inverted at any age (is more often inverted than upright) and the T in V2 can normally be inverted.
- When the T in V1 is upright, it is almost never as tall as the T in V6.
- In infants and young children precordial T waves may be inverted.
- In adult males it is considered abnormal if the T waves are inverted as far to the left as lead V3.
- In adult females the T in V3 may be shallowly inverted.
aVF
- Normally upright in aVL and aVF if the QRS is > 5 mm tall but may be inverted if the R waves are smaller.
- It is not uncommon to have an isolated negative T wave in lead III, aVL, or aVF. Cardiologists are often asked to consult pre-operativley on the patient with the isolated flipped T in lead III.
aVR
- Normally inverted in aVR.
In The Presence of Conduction Delay
- When a conduction abnormality (e.g., left bundle branch block,right bundle branch block, or a paced rhythm) is present, the T wave should be deflected opposite the terminal deflection of the QRS complex. This is known as appropriate T wave discordance. If the T waves are oriented in the same direction as the QRS complex, this is termed T wave concordance, and may be a sign of ischemia in the presence of left bundle branch block.
Differential Diagnosis of Inverted or Negative T waves:
- Coronary ischemia
- Left ventricular hypertrophy
- CNS disorder.
Morphology of T waves
Shown below is an example of an ECG showing various morphologies of T wave.

Shape
Notched
- Notched in children and in adults with Pericarditis
Differential diagnosis of the sharp, tented or pointed T wave
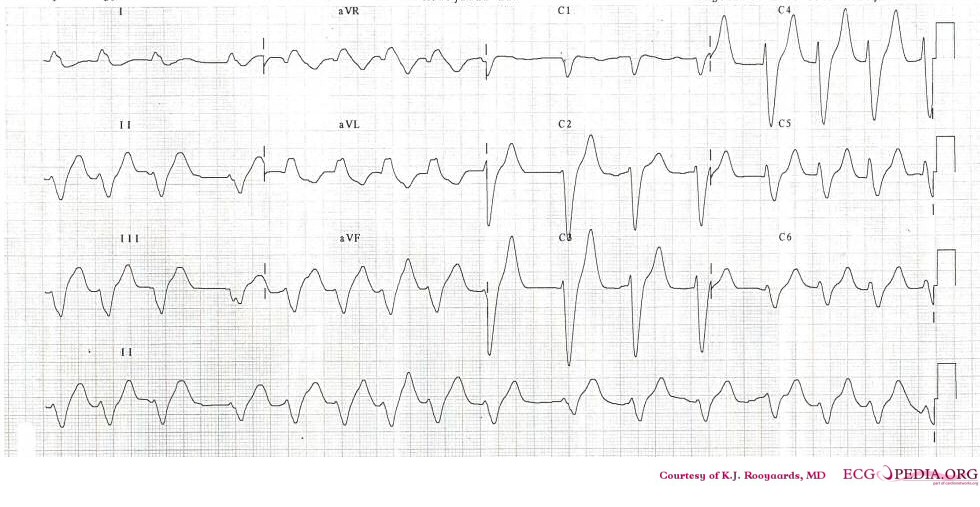
- Tall or "tented" symmetrical T waves may indicate hyperkalemia.
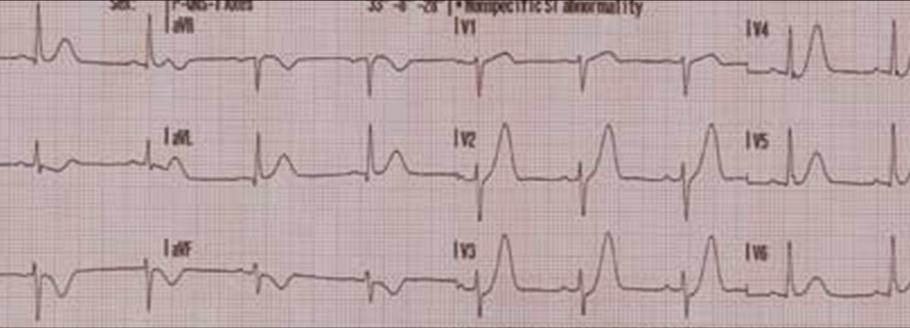
- One of the earliest electrocardiographic finding of acute myocardial infarction is sometimes the hyperacute T wave, which can be distinguished from hyperkalemia by the broad base and slight asymmetry.
- T waves can be sharply pointed in ischemia as well.
Height
The T wave is normally not taller than > 5 mm in any standard lead and not taller than > 10 mm in any precordial lead.
Differential diagnosis of the tall T wave:
- Hyperkalemia
- Left ventricular hypertrophy
- Myocardial Ischemia
- Myocardial infarction
- Ventricular strain
- Psychosis
- Cerebrovascular accident (usually inverted, widely splayed, frequently in subarrachnoid hemorrhages)
Differential diagnosis of the short or flat T wave:
- Coronary ischemia
- Hypokalemia.
- Obesity. This finding may reverse with weight loss
Significance of T-waves
Except in Hyperkalemia abnormality in T-wave alone is not diagnostic of any particular condition. Usually, T-wave abnormalities can provide added evidence to support clinical diagnosis.[1]
Cerebral T waves
Overview
In 1954 George Burch described T wave abnormalities as myocardial ischemia mimics in patients with a variety of acute cerebral insults. His classic paper [2] published in May 1954 popularized the term Cerebral T waves. The T waves were described as large, were similar to those seen in early myocardial isehemia, and were reported to revert to normal with improvement of the clinical condition, or changed to the pattern of any underlying heart disease present prior to the intracranial insult. They usually appear as diffuse giant T-wave inversions or large, upright T-waves or sometimes as flat T-waves.
Etiological Theories
Originally the cause was thought to be preexisting coronary artery disease exacerbated by the physiological demands of the critical illness. However in many cases, the autopsy studies of the heart showed no macroscopic evidence of significant coronary artery stenosis or myocardial infarction.
Hironosuke et al[3] proposed widespread focal myocytolysis due to overstimulation of sympathetic centres in the hypothalamus leading to release of catecholamines which could damage myocardial cells
- By inducing constriction of the myocardial microcirculation, thus leading to focal ischemia or
- By a direct toxic effect
as the mechanism which result in the ECG changes seen in Subarachnoid hemorrhage.
After studying the characteristic pattern of focal myocardial lesions, some researchers proposed that the damaging catecholamines are released from intramyocardial nerve endings rather than from the general (systemic) circulation.[4] This focal myocytolysis is different from myocardial infarction histologically and seems to have no prelidiction for subendocardial zone which is typical for myocardial infarction. [3]
Rogers et al[5] produced increases and decreases in the amplitude of the T wave in cats by stimulating the right and left sides of the hypothalamus and stellate ganglia respectively. They suggested that the mechanism is unilateral alteration of sympathetic tone to the heart.
Some studies proposed the ECG changes in acute cerebral events are due to the stimulation or injury to insular cortex which is proven to have cardiovascular effects on stimulation.[6][7]
The suggestion that cerebral T waves are neurally induced is supported by the observation that inverted T waves may normalize if brain death occurs.
Incidence and Prevalence
According to study on 150 acute stroke patients by David S Goldstein, T-wave inversions (Cerebral T-waves) were noticed in up to 29% of them.[8]
In one case series, the ECG pattern of Cerebral T-waves with prolonged QT interval was seen in 72% of patients with subarachnoid hemorrhage and 57% of patients with intraparenchymal hemorrhage.
In a study of 100 consecutive patients with cerebrovascular accident(CVA), it is noted that there is 2 to 4 fold higher incidence of Cerebral T waves when compared to control group.[9]
New T wave abnormality, Cerebral or Cardiac???
In the acute setting, it is very significant to accurately interpret new T-wave changes to arrive at a diagnosis and provide timely intervention.
- History taking should include questions about past and present history of significant cardiovascular symptoms to rule out underlying heart disease. If any heart disease is present, the chances of it causing the abnormality should be considered.
- Quick correlation should be made with the rest of the ECG and clinical presentation of the patient.
- A quick neurological exam can be done to rule out cerebral origin of T-wave abnormality.
- In cases where neurological exam is not possible due to patient condition, QT interval should be evaluated. Usually in cerebral causes, there is associated prolonged QT interval versus normal QT interval seen in myocardial infarction.[1]
However, to arrive at a definitive diagnosis, methods for diagnosing acute myocardial injury are necessary like
- Echocardiography
- Lab tests to detect elevated levels of biochemical markers of myocardial injury and
- Autopsy findings in case death occurs.
Non-specific flipped T waves
Causes
- CAD/ischemia
- Cardiomyopathies
- Myocarditis, pericarditis
- PE
- Valvular disorders
- CNS bleed
- LVH, BBB, paced[10]
Shown below is an example of an ECG showing non specific flipped T waves.
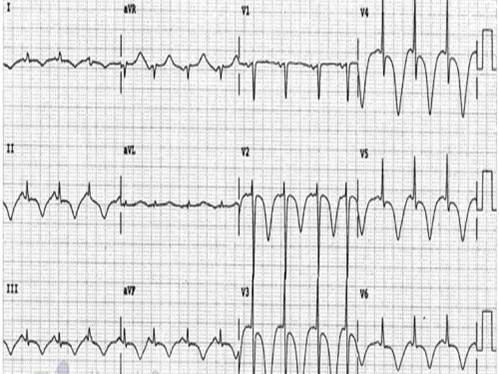
Examples
Shown below is an example of an ECG demonstrating tall peaked T waves seen in hyperkalemia.

Shown below is an example of ECG showing tall peaked T waves (seen in hyperkalemia).
Shown below is an example of an ECG showing T wave inversions and appearance of U wave.

Shown below is an example of ECG showing hyperacute, asymmetrical and broad based T waves in anterior leads; also showing poor R wave progression
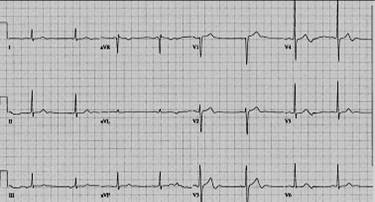
Shown below is an example of an ECG showing tall T waves in V1 seen in Left bundle branch block and left ventricular hypertrophy
Shown below is an EKG demonstrating typical negative T waves post anterior myocardial infarction. This patient also shows QTc prolongation. Whether this has an effect on prognosis is debated. [11][12][13]
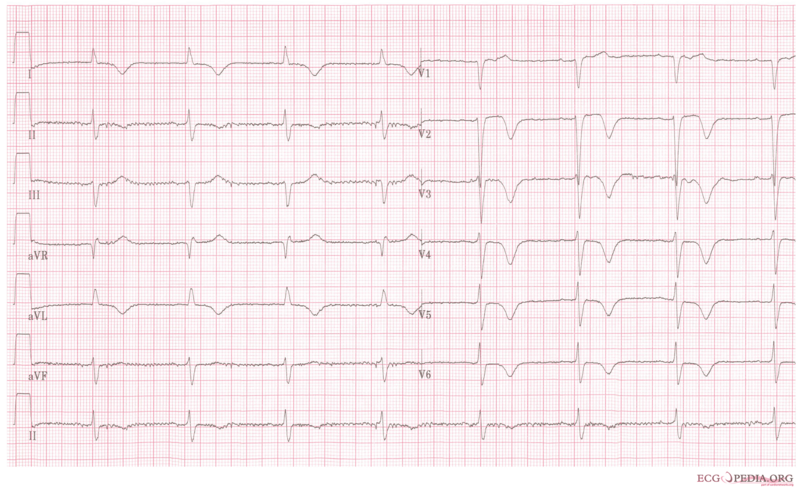
Copyleft image obtained courtesy of, http://en.ecgpedia.org/wiki/Main_Page Normal 0 false false false EN-US X-NONE X-NONE
Sources
Copyleft images obtained - courtesy of ECGpedia, [3]
References
- ↑ 1.0 1.1 Catanzaro JN, Meraj PM, Zheng S, Bloom G, Roethel M, Makaryus AN (2008). "Electrocardiographic T-wave changes underlying acute cardiac and cerebral events". The American Journal of Emergency Medicine. 26 (6): 716–20. doi:10.1016/j.ajem.2007.10.017. PMID 18606329. Retrieved 2012-05-31. Unknown parameter
|month=ignored (help) - ↑ http://circ.ahajournals.org/content/9/5/719.full.pdf
- ↑ 3.0 3.1 Sakamoto H, Nishimura H, Imataka K, Ieki K, Horie T, Fujii J (1996). "Abnormal Q wave, ST-segment elevation, T-wave inversion, and widespread focal myocytolysis associated with subarachnoid hemorrhage". Japanese Circulation Journal. 60 (4): 254–7. PMID 8726174. Retrieved 2012-05-30. Unknown parameter
|month=ignored (help) - ↑ Baroldi G. Pathologic evidence of myocardial damage following acute brain injuries. In: Di Pasquale G, Pinelli G, eds. Heart-Brain Interactions. New York, NY: Springer-Verlag
- ↑ Rogers MC, Abildskov JA, Preston JB (1973). "Neurogenic ECG changes in critically ill patients: an experimental model". Critical Care Medicine. 1 (4): 192–6. PMID 4764357.
|access-date=requires|url=(help) - ↑ Svigelj V, Grad A, Tekavcic I, Kiauta T (1994). "Cardiac arrhythmia associated with reversible damage to insula in a patients with subarachnoid hemorrhage". Stroke; a Journal of Cerebral Circulation. 25 (5): 1053–5. PMID 8165677. Unknown parameter
|month=ignored (help);|access-date=requires|url=(help) - ↑ Oppenheimer SM, Gelb A, Girvin JP, Hachinski VC (1992). "Cardiovascular effects of human insular cortex stimulation". Neurology. 42 (9): 1727–32. PMID 1513461. Unknown parameter
|month=ignored (help);|access-date=requires|url=(help) - ↑ Goldstein DS (1979). "The electrocardiogram in stroke: relationship to pathophysiological type and comparison with prior tracings". Stroke; a Journal of Cerebral Circulation. 10 (3): 253–9. PMID 462510. Retrieved 2012-05-30.
- ↑ Dimant J, Grob D (1977). "Electrocardiographic changes and myocardial damage in patients with acute cerebrovascular accidents". Stroke; a Journal of Cerebral Circulation. 8 (4): 448–55. PMID 898240. Retrieved 2012-05-31.
- ↑ http://www.google.com/url?sa=t&rct=j&q=&esrc=s&source=web&cd=1&cad=rja&ved=0CCYQFjAA&url=http%3A%2F%2Fwww.medschool.lsuhsc.edu%2Femergency_medicine%2Fdocs%2FTop%2520Ten%2520(or%252011)%2520EKG%2520Killers.ppt&ei=PXJeUJ0xp9rRAbOOgagK&usg=AFQjCNGGRSrJfRVl3cMy5au0lnmpeaBRQA
- ↑ Novotný T, Sisáková M, Floriánová A; et al. (2007). "[QT dynamicity in risk stratification in patients after myocardial infarction]". Vnitr Lek (in Czech). 53 (9): 964–7. PMID 18019666. Unknown parameter
|month=ignored (help) - ↑ Jensen BT, Abildstrom SZ, Larroude CE; et al. (2005). "QT dynamics in risk stratification after myocardial infarction". Heart Rhythm. 2 (4): 357–64. doi:10.1016/j.hrthm.2004.12.028. PMID 15851335. Unknown parameter
|month=ignored (help) - ↑ Chevalier P, Burri H, Adeleine P; et al. (2003). "QT dynamicity and sudden death after myocardial infarction: results of a long-term follow-up study". J. Cardiovasc. Electrophysiol. 14 (3): 227–33. PMID 12716101. Unknown parameter
|month=ignored (help)
Additional resources
- ECGpedia: Course for interpretation of ECG
- The whole ECG - A basic ECG primer
- 12-lead ECG library
- Simulation tool to demonstrate and study the relation between the electric activity of the heart and the ECG
- ECG information from Children's Hospital Heart Center, Seattle
- ECG Challenge from the ACC D2B Initiative
- National Heart, Lung, and Blood Institute, Diseases and Conditions Index
- A history of electrocardiography
- EKG Interpretations in infants and children