P wave

|
WikiDoc Resources for P wave |
|
Articles |
|---|
|
Media |
|
Evidence Based Medicine |
|
Clinical Trials |
|
Ongoing Trials on P wave at Clinical Trials.gov Clinical Trials on P wave at Google
|
|
Guidelines / Policies / Govt |
|
US National Guidelines Clearinghouse on P wave
|
|
Books |
|
News |
|
Commentary |
|
Definitions |
|
Patient Resources / Community |
|
Directions to Hospitals Treating P wave Risk calculators and risk factors for P wave
|
|
Healthcare Provider Resources |
|
Continuing Medical Education (CME) |
|
International |
|
|
|
Business |
|
Experimental / Informatics |
Editor-In-Chief: C. Michael Gibson, M.S., M.D. [1]; Assistant Editor(s)-in-Chief: Rim Halaby
Overview
During normal atrial depolarization, the main electrical vector is directed from the SA node towards the AV node, and spreads from the right atrium to the left atrium. This turns into the P wave on the ECG, which is upright in II, III, and aVF (since the general electrical activity is going toward the positive electrode in those leads), and inverted in aVR (since it is going away from the positive electrode for that lead). The P-wave morphology is best determined in leads II and V1 during sinus rhythm.
The P Wave Morphology
- The P wave represents atrial depolarization (stimulation).
- At either slow or normal heart rates, the small, rounded P wave is clearly visible just before the taller, more peaked QRS complex.
- At more rapid rates, however, the P wave may merge with the preceding T wave and become difficult to identify. Sinus node depolarization is too small in amplitude to be recorded from the body surface so it is not seen.
Steps in the evaluation of the P wave
- 1. Examination of the P wave contour:
- The P wave contour is normally smooth, and is either entirely positive or entirely negative wave (monophasic wave) in all leads except V1.
- 2. Measurement of the P wave duration:
- The P wave duration is normally less than 0.12 seconds.
- 3. Measurement of the maximal P wave amplitude:
- The maximal P-wave amplitude is normally no more than 0.2 mV in the frontal plane leads and no more than 0.1 mV in the transverse plane leads.
- 4. Estimation of the P wave axis:
- The P wave normally appears entirely upright on leftward and inferiorly oriented leads such as I, II, aVF, and V4 to V6. It is negative in aVR because of the rightward orientation of that lead, and it is variable in the other standard leads. The normal limits of the P wave axis are 0 degrees and +75 degrees.
| Characteristics of a normal p wave:Spodick |
|---|
|
- Shown below is an electrocardiogram depicting a normal sinus rhythm with a positive p wave in leads I, II and aVF and a biphasic P wave in V1.

The P Wave in Normal Sinus Rhythm
- A P wave must be upright in leads II and aVF and inverted in lead aVR to designate a cardiac rhythm as normal sinus rhythm. The relationship between P waves and QRS complexes helps distinguish various cardiac arrhythmias.
- If the P wave is inverted, then the origin of the rhythm may be in the low atrial region.
- Widened P waves can be a sign of Class Ia antiarrhythmic drugs intoxication (quinidine, etc.)
- Small or absent P waves can be a sign of hyperkalemia.
Abnormal P Wave Examples
- Elevation or depression of the PTa segment (the part between the p wave and the beginning of the QRS complex) can result from atrial infarction or pericarditis.
- Shown below is an image depicting abnormalities in the PTa segment.

- Altered P wave morphology is seen in left or right atrial enlargement. If the p-wave is enlarged, the atria are enlarged.
- Shown below is an image depicting abnormalities in the P wave morphology.

The P Wave in Left Atrial Enlargement
- The shape and duration of the P waves may indicate atrial enlargement. Left atrial enlargement may be observed among patients with mitral insufficiency.
- Left atrial enlargement is defined as either:
- P wave with a broad (>0.04 sec or 1 small suare) and deeply negative (>1 mm) terminal part in V1 (P mitrale)
- P wave duration >0.12 sec in leads I and / or II
- Shown below are an image illustrating left atrial enlargement and electrocardiograms depicting changes in left atrial enlargement.
-
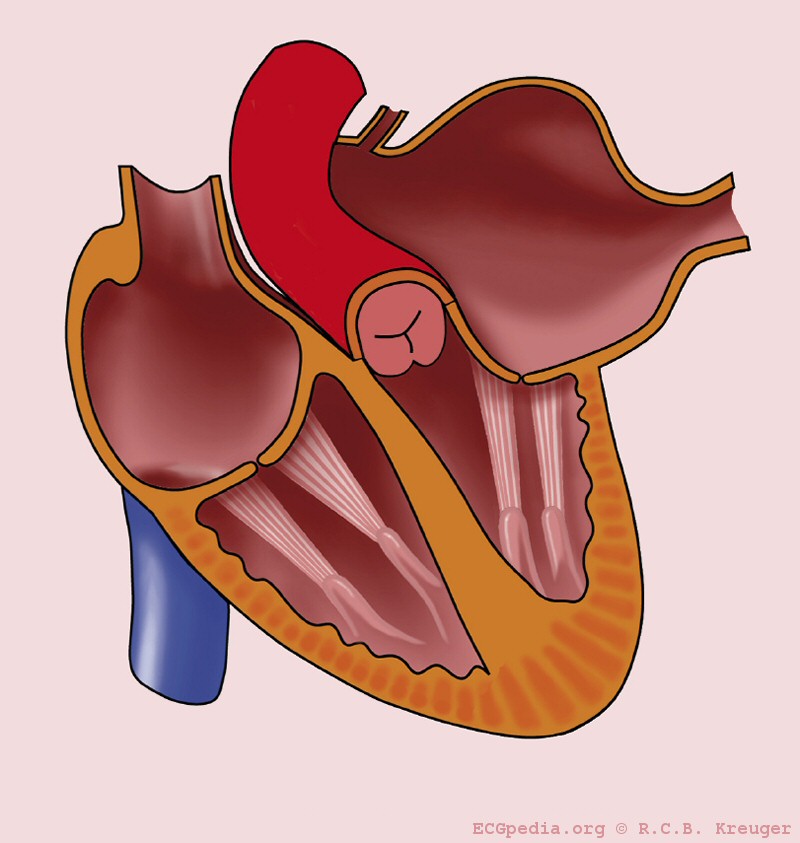
Left atrial enlargement
-
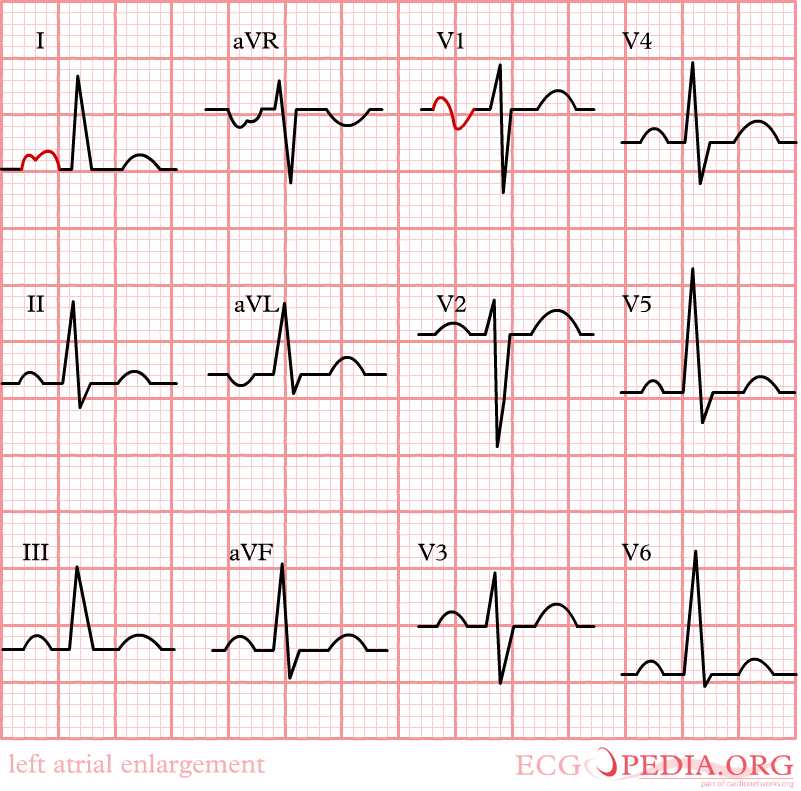
Left atrial enlargement with ECG.
-
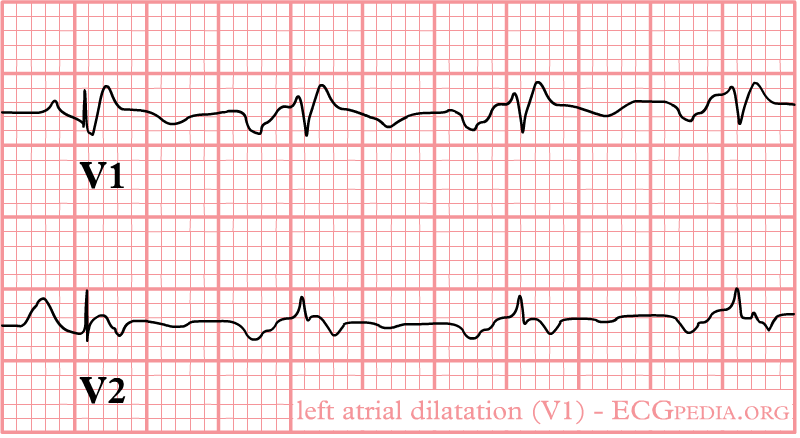
Left atrial enlargement as seen in lead V1.
-
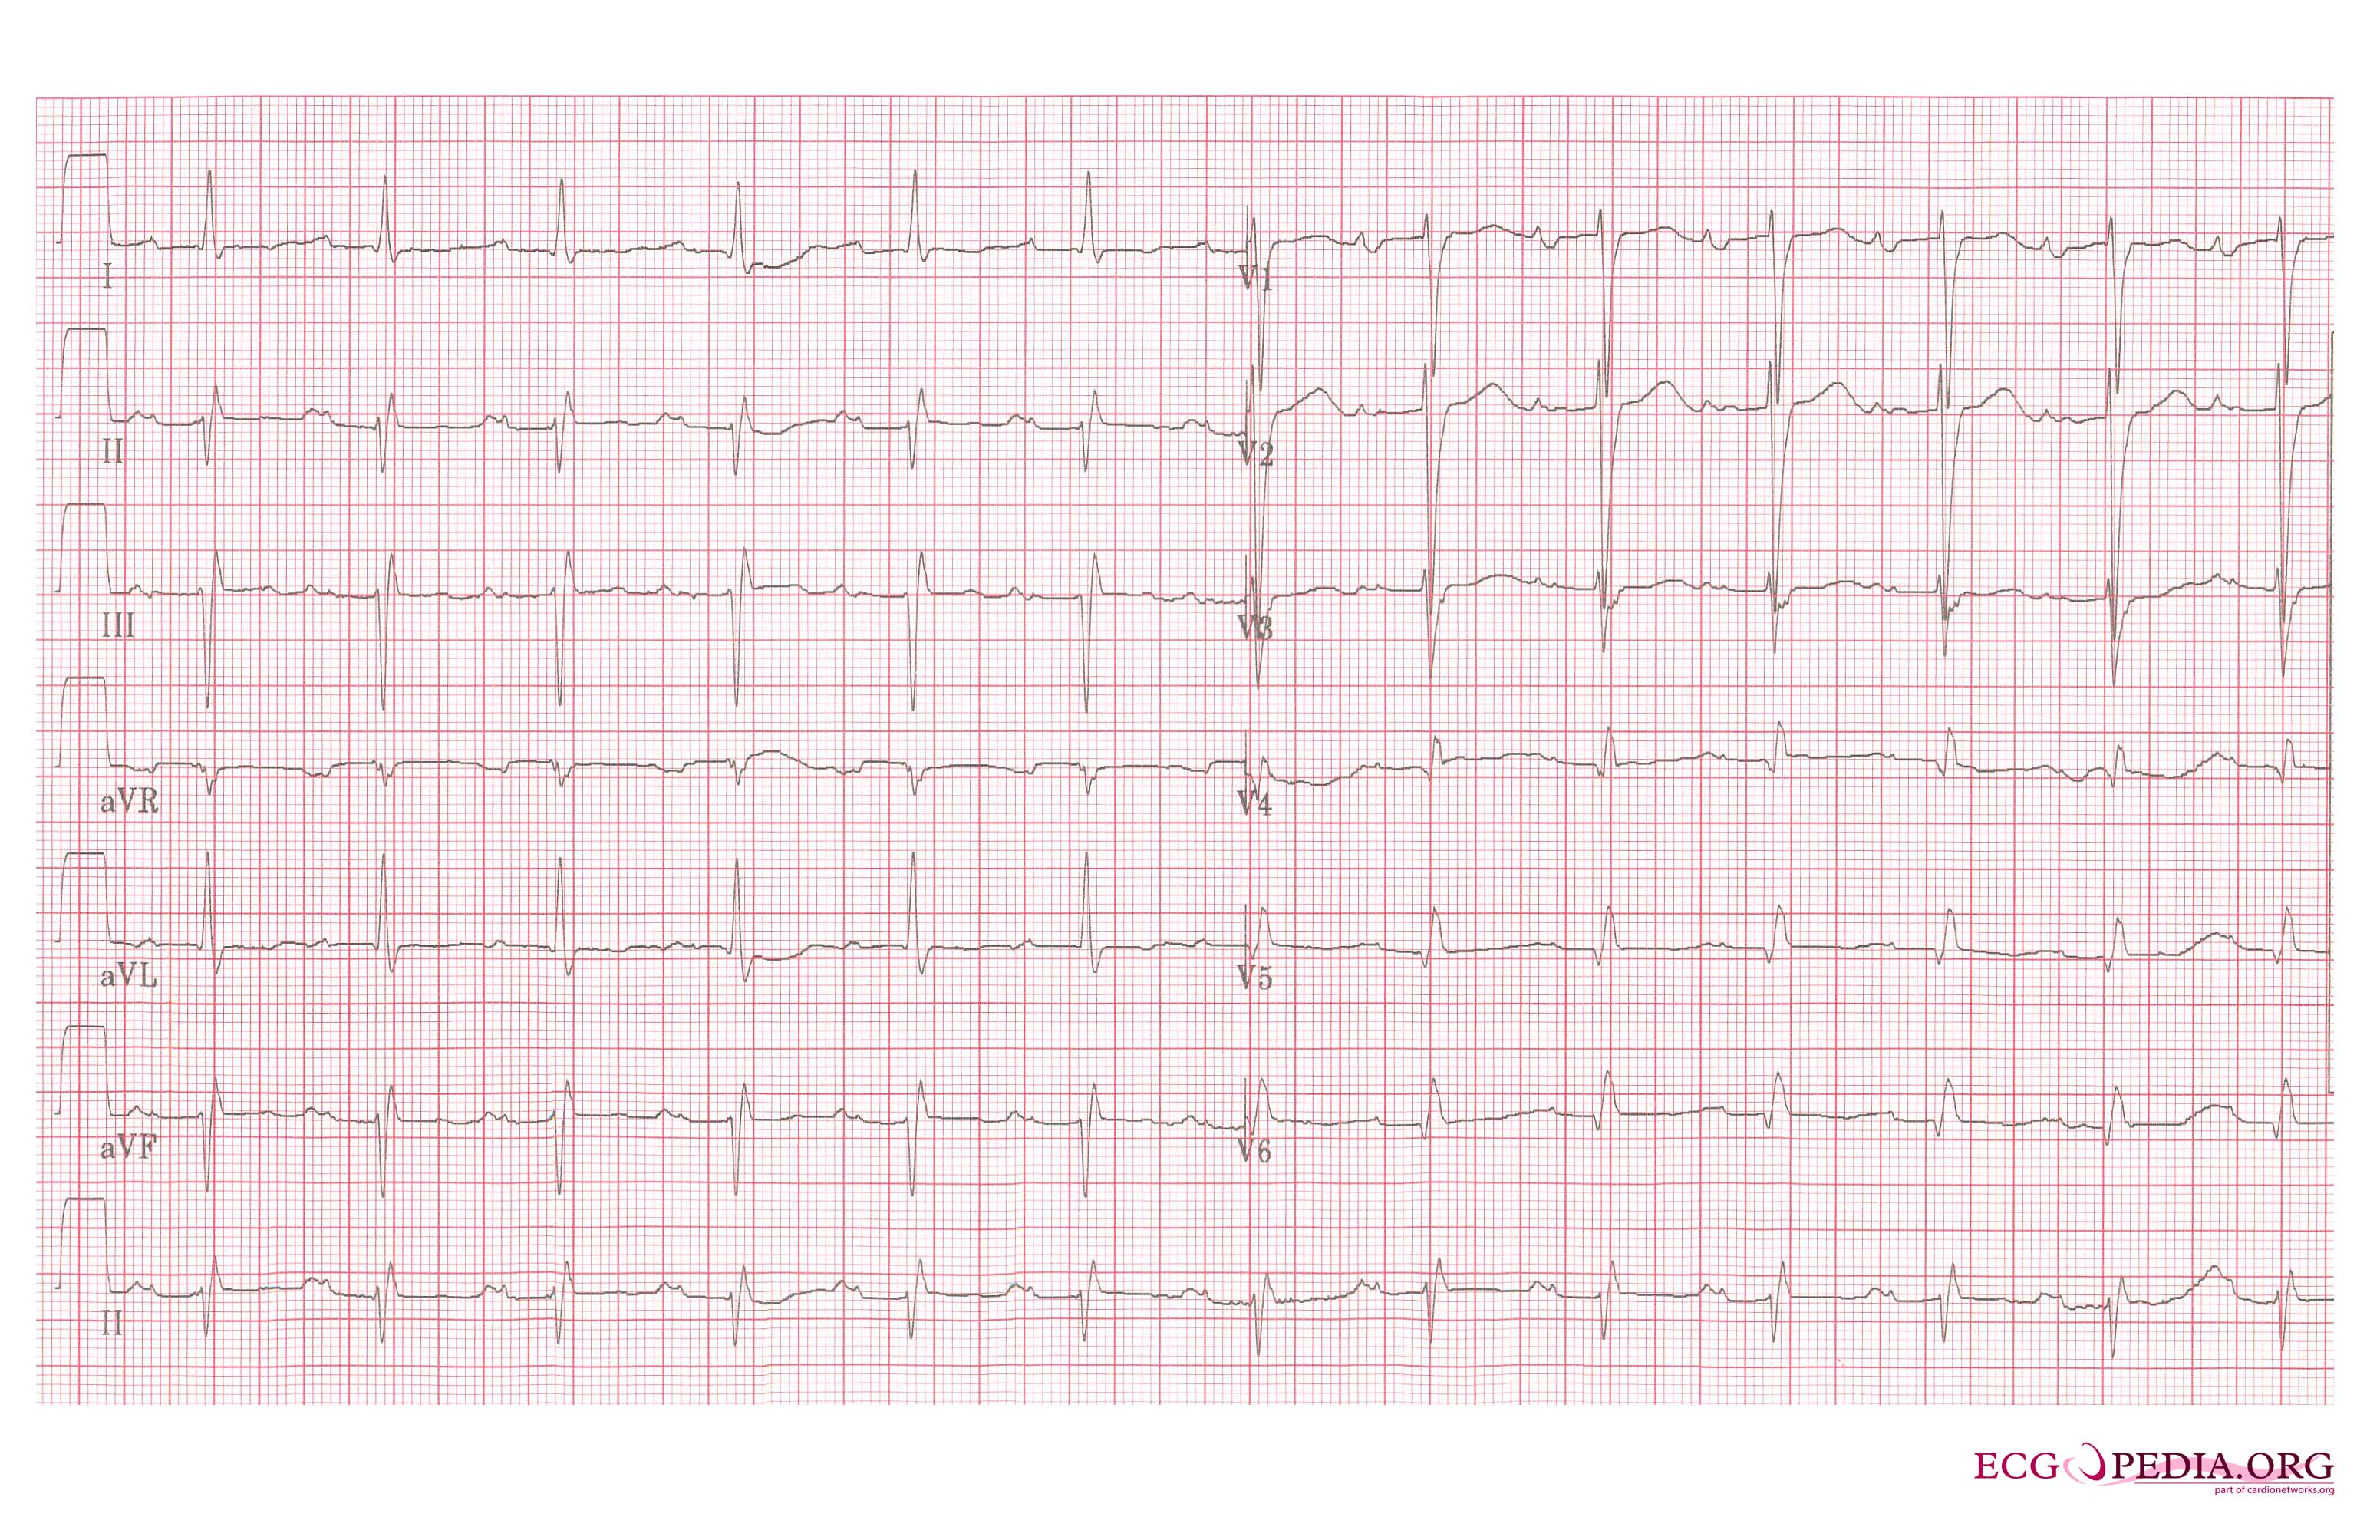
Left atrial enlargement, a 12 lead ECG


Differential Diagnosis of Left Atrial Enlargement
In alphabetical order
- Atrial aneurysm
- Infective endocarditis
- Left heart failure
- Mitral regurgitation
- Mitral stenosis
- Mitral valve prolapse
- Myxedma
- Patent Ductus Arteriosus
- Ventricular septal defect
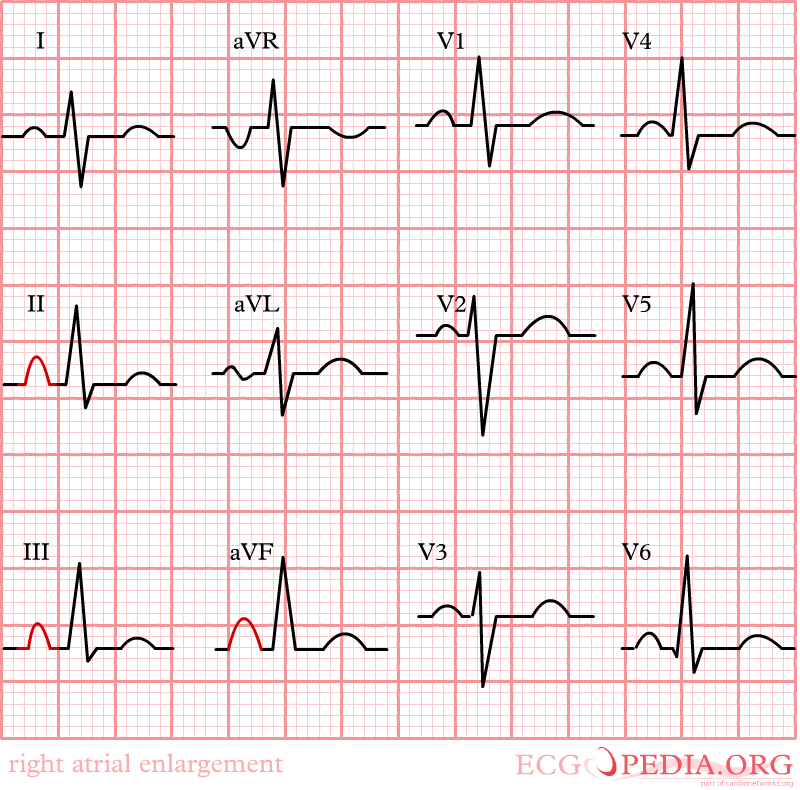
The P Wave in Right Atrial Enlargement
- Right atrial enlargement can result from increased right-sided pressures such as those related to valvular lesions and after pulmonary embolism.
- A positive part of the biphasic P wave in lead V1 larger than the negative part indicates right atrial enlargement.
- The width of the P wave is not part of the criteria for right atrial enlargement.
- Right atrial enlargement is defined as either:
- P is taller than 2.5 mm in II / III and / or aVF (P pulmonale)
- P >1.5 mm in V1
- Shown below are an image illustrating right atrial enlargement and electrocardiograms depicting changes in right atrial enlargement.
-

Right atrial enlargement
-
Right atrial enlargement


Differential Diagnosis of Right Atrial Enlargement
In alphabetical order
- Atrial aneurysm
- Atrial septal defect
- Ebstein's anomaly
- Pulmonic stenosis
- Right heart failure
- Tricuspid prolapse
- Tricuspid regurgitation
- Tricuspid stenosis
- Tumor
Differential Diagnosis of Inverted P Waves in I and aVL
- It is possible to distinguish lead reversal and dextrocardia by watching the precordial leads. Dextrocardia will show an R wave inversion, whereas lead reversal will not.
- This bottom EKG shows marked right axis deviation and loss of voltage across the precordium. There are also inverted P waves in leads I and aVL. The differential for inverted P waves in lead I and aVL is Dextrocardia vs Reversed Arm Leads. Since there is loss of voltage across the precordium this is Dextrocardia.
- If the P waves are inverted in the other leads, then this may indicate that there is a low atrial focus to the origin of the rhythm.
- Shown below is an image depicting the difference in precordial R wave progression between lead reversal and dextrocardia.

- Shown below is an electrocardiogram depicting changes associated with dextrocardia

Inverted P Wave in the Inferior Leads
Causes
- P waves are inverted in the inferior leads in the setting of a low atrial focus as the origin of the rhythm.
- Shown below is an electrocardiogram depicting inverted P waves.

Sources
- Copyleft images obtained courtesy of ECGpedia, http://en.ecgpedia.org/index.php?title=Special:NewFiles&dir=prev&offset=20080806182927&limit=500