QRS complex: Difference between revisions
| Line 56: | Line 56: | ||
== QRS Amplitude == | == QRS Amplitude == | ||
===Low Voltage=== | |||
The presence of low voltage on the EKG should prompt the caregiver to rule out [[cardiac tamponade]] or a large [[pericardial effusion]] which can be life threatening. These tow diagnoses are suggeted by the present of [[tachycardia]] and [[electrical alternans]] along with the [[low QRS voltage]] | |||
===Definitions of Low Voltage:=== | ===Definitions of Low Voltage:=== | ||
* If the total amplitude above and below the isoelectric line is < 5 mm in all 3 standard leads. | * If the total amplitude above and below the isoelectric line is < 5 mm in all 3 standard leads. | ||
Revision as of 19:37, 11 September 2011

|
WikiDoc Resources for QRS complex |
|
Articles |
|---|
|
Most recent articles on QRS complex Most cited articles on QRS complex |
|
Media |
|
Powerpoint slides on QRS complex |
|
Evidence Based Medicine |
|
Clinical Trials |
|
Ongoing Trials on QRS complex at Clinical Trials.gov Clinical Trials on QRS complex at Google
|
|
Guidelines / Policies / Govt |
|
US National Guidelines Clearinghouse on QRS complex
|
|
Books |
|
News |
|
Commentary |
|
Definitions |
|
Patient Resources / Community |
|
Patient resources on QRS complex Discussion groups on QRS complex Patient Handouts on QRS complex Directions to Hospitals Treating QRS complex Risk calculators and risk factors for QRS complex
|
|
Healthcare Provider Resources |
|
Causes & Risk Factors for QRS complex |
|
Continuing Medical Education (CME) |
|
International |
|
|
|
Business |
|
Experimental / Informatics |
Editor-In-Chief: C. Michael Gibson, M.S., M.D. [1]; Associate Editor-In-Chief: Cafer Zorkun, M.D., Ph.D. [2]
Overview
The QRS complex represents electrical activation of the ventricle. Widening of the QRS complex may reflect delayed conduction in the His, bundle branch or purkinje conduction system.
Morphology of the QRS Complex
Q wave
If the first deflection of the QRS is downward, it’s called a Q wave. The Q wave represents activation of the ventricular septum. The electricity spreads from right to left through the septum.
Q waves may be normal. For example in lead I, a Q less than 1/4 of the R height, and less than one box wide, is considered normal. This is the early activation of the septum. This activation goes left — away from lead I — and is therefore negative on the ECG. “Septal Qs” are normal in I, F, V5 and V6. Qs are also generally innocent in lead III and lead V1 if no other abnormality is seen.
Q waves are “significant” if they are greater than 1 box in width (longer than 0.04 msec) OR are larger than 1/4 of the R wave.
Q waves can be seen on the electrocardiogram following necrosis of the myocardium such as seen in acute MI or the replacement of electrically active tissue with electrically inert tissue as seen with Chagas disease. A q wave may also reflect septal hypertrophy in hypertrophic cardiomyopathy (HCM).
Causes of Q waves in the Absence of Myocardial Infarction
- A QS complex in lead V1 is normal.
- A Q wave <0.03 s and <1/4 of the R wave amplitude in lead III is normal if the frontal QRS axis is between 30 and 0°.
- The Q wave may be normal in aVL if the frontal QRS axis is between 60 and 90°. Small septal Q waves are non pathological Q waves if <0.03 s and <1/4 of the R wave amplitude in leads I, aVL, aVF, and V4-V5-V6
- The following may be associated with Q/QS complexes in the absence of myocardial infarction:
- Chagas disease
- Hypertrophic cardiomyopathy
- Preexcitation syndromes
- Obstructive or dilated cardiomyopathy
- LBBB
- RBBB
- Left anterior fascicular block
- LVH
- RVH
- Myocarditis
- Acute cor pulmonale
- Hyperkalemia
EKG Changes of Prior Myocardial Infarction
- Any Q wave in V2-V3 ≥0.02 sec or presence of QS complex in V2 and V3.
- Q wave ≥0.03 sec and ≥0.1 mV deep or presence of QS complexes in leads I, II, aVL, aVF or V4-V5-V6 in any two leads of a contiguous lead grouping (I, aVL, V6; V4-V5-V6, II, III and aVF). The same criteria are used for supplemental leads V7-V8-V9, and for the Cabrera frontal plane leads.
- R wave ≥0.04 sec in V1-V2 and R/S >1 with a concordant positive T wave in the absence of a conduction defect.[1]
R wave
The first upward deflection of the QRS is called the R wave. Most of the ventricle is activated during the R wave. The R wave may be prolonged if the ventricle is enlarged, and may be abnormally high (indicating strong voltage) if the ventricular muscle tissue is hypertrophied.
S wave
The S wave is any downward deflection following the R wave. Like the R wave, an abnormally large S wave may indicate hypertrophy of the ventricle.
If a second upward deflection is seen, it’s called an R-prime wave. R-prime waves are never normal, but indicate a problem in the ventricular conduction system.
QRS complexes may be described by naming the waves that form them. For example, a complex with an R, an S, and an R’ is called an RSR’ complex.
QRS Duration
- The normal duration is less than 0.12 seconds
- If the duation is > 0.12 seconds then either left bundle branch block (LBBB), right bundle branch block (RBBB) or a non-specific intraventricular conduction delay is present.
- The precordial leads are approximately 0.01 or 0.02 seconds longer than the limb leads.
QRS Amplitude
Low Voltage
The presence of low voltage on the EKG should prompt the caregiver to rule out cardiac tamponade or a large pericardial effusion which can be life threatening. These tow diagnoses are suggeted by the present of tachycardia and electrical alternans along with the low QRS voltage
Definitions of Low Voltage:
- If the total amplitude above and below the isoelectric line is < 5 mm in all 3 standard leads.
- An average voltage in the limb leads of < 5 mm with an average of < 10 mm in the chest leads (1).
- Should be at least 5 mm in V1 and V6 , 7 mm in V2 and V5 and 9 mm in V3 and V4.
Differential Diagnosis of Underlying Causes of Low QRS Voltage
Three general processes contribute to low QRS voltage:
- Damping of the electrical signal due to excess air (emphysema, COPD), fluid (pericardial effusion, pleural effusion), edema (anasarca) or fat (obesity)
- Electrically inert myocardium due to a loss of viable myocardium
- Infiltration of the myocardium (myxedematous, Chagas disease)
In alphabetical order:
- Amyloidosis
- Anasarca[2]
- Dilated cardiomyopathy[3]
- Chagas disease
- Diffuse coronary artery disease
- Congestive heart failure
- Constrictive pericarditis
- COPD
- Generalized edema and pedal edema[2]
- Emphysema
- Hypothyroidism
- Prior myocardial infarction
- Myocarditis
- Myxedema
- Obesity
- Pericardial effusion
- Pneumothorax
- Scleroderma
- Tamponade
Definition of Maximal QRS Voltage:
Can be up to 20 to 30 mm in lead 2 and can be up to 25 to 30 mm in the precordial leads. [4] [5]
References
- ↑ Thygesen K, Alpert JS, White HD (2007). "Task Force for the Redefinition of Myocardial Infarction. Universal definition of myocardial infarction Joint ESC/ACCF/AHA/WHF". Circulation. 2007: 2634–2653. PMID 17951284.
- ↑ 2.0 2.1 Madias JE (2008). "Low QRS voltage and its causes". J Electrocardiol. 41 (6): 498–500. doi:10.1016/j.jelectrocard.2008.06.021. PMID 18804788.
- ↑ Chinitz JS, Cooper JM, Verdino RJ (2008). "Electrocardiogram voltage discordance: interpretation of low QRS voltage only in the limb leads". J Electrocardiol. 41 (4): 281–6. doi:10.1016/j.jelectrocard.2007.12.001. PMID 18353352.
- ↑ Unverferth, Chest 1979: 75, 157.
- ↑ Hammill S. C. Electrocardiographic diagnoses: Criteria and definitions of abnormalities, Chapter 18, MAYO Clinic, Concise Textbook of Cardiology, 3rd edition, 2007 ISBN 0-8493-9057-5.
Additional resources
- ECGpedia: Course for interpretation of ECG
- The whole ECG - A basic ECG primer
- 12-lead ECG library
- Simulation tool to demonstrate and study the relation between the electric activity of the heart and the ECG
- National Heart, Lung, and Blood Institute, Diseases and Conditions Index
- A history of electrocardiography
- EKG Interpretations in infants and children
Examples
-
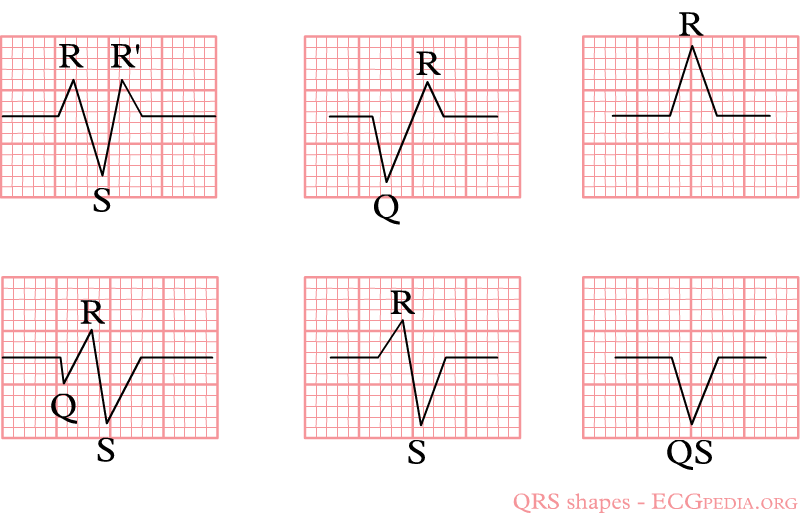
Diagram shows different types of QRS shapes
