Electrocardiogram: Difference between revisions
| Line 39: | Line 39: | ||
Shown below is an image of electrocardiographic recording from a monitor set at 40Hz filter. | Shown below is an image of electrocardiographic recording from a monitor set at 40Hz filter. | ||
[[Image:Filter_settings.png|500px]] | [[Image:Filter_settings.png|left|500px]] | ||
<br clear="left"/> | <br clear="left"/> | ||
Revision as of 17:41, 15 October 2012


Editor-In-Chief: C. Michael Gibson, M.S., M.D. [2]
Overview
An electrocardiogram (ECG or EKG, abbreviated from the German Elektrokardiogramm) is a graphic produced by an electrocardiograph, which records the electrical activity of the heart over time. Its name is made of different parts: electro, because it's related to electronics, cardio, Greek for heart, gram, a Greek root meaning "to write". Analysis of the various waves and normal vectors of depolarization and repolarization yields important diagnostic information.
- It is the gold standard for the diagnosis of cardiac arrhythmias[1]
- It guides therapy and risk stratification for patients with suspected acute myocardial infarction[2]
- It helps detect electrolyte disturbances (e.g. hyperkalemia and hypokalemia)[3]
- It allows for the detection of conduction abnormalities (e.g. right and left bundle branch block)[4]
- It is used as a screening tool for ischemic heart disease during a cardiac stress test[5]
- It is occasionally helpful with non-cardiac diseases (e.g. pulmonary embolism or hypothermia)[3]
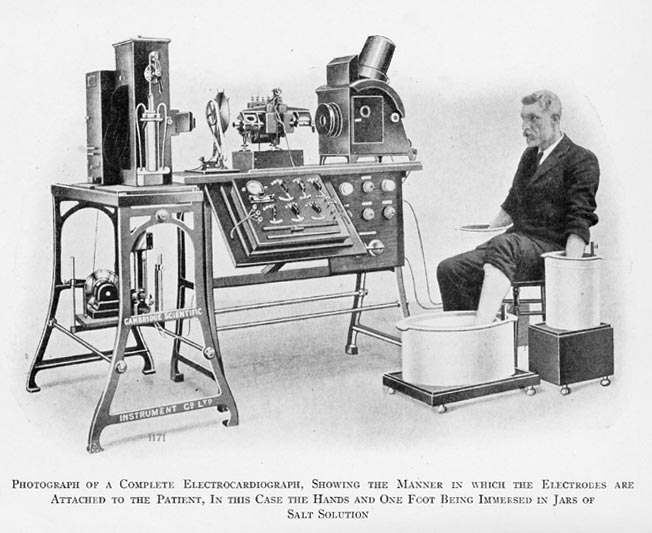
The electrocardiogram does not directly assess the contractility of the heart. However, it can give a rough indication of increased or decreased contractility.[6]Alexander Muirhead attached wires to a feverish patient's wrist to obtain a record of the patient's heartbeat while studying for his DSc (in electricity) in 1872 at St Bartholomew's Hospital[7] This activity was directly recorded and visualized using a Lippmann capillary electrometer by the British physiologist John Burdon Sanderson.[8] The first to systematically approach the heart from an electrical point-of-view was Augustus Waller, working in St Mary's Hospital in Paddington, London.[9] His electrocardiograph machine consisted of a Lippmann capillary electrometer fixed to a projector. The trace from the heartbeat was projected onto a photographic plate which was itself fixed to a toy train. [3] This allowed a heartbeat to be recorded in real time. In 1911 he still saw little clinical application for his work.
-
The first generation of EKG
-
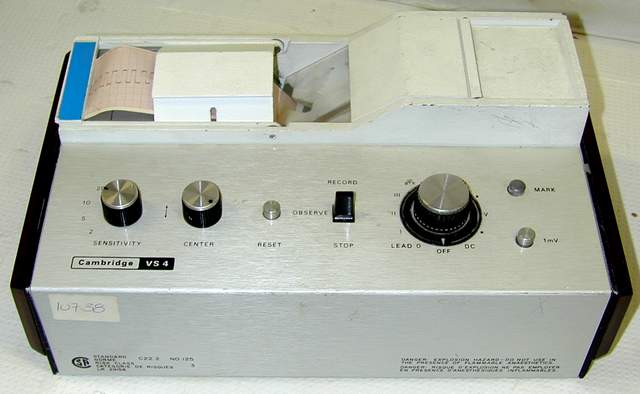
The Cambridge VS4, a popular ECG instrument of the 1970s and 1980s. Solid state technology.
-
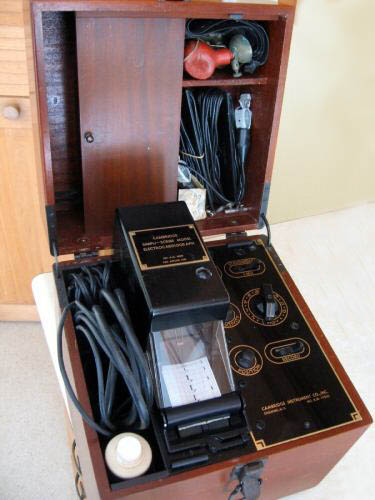
The Cambridge Simpliscribe, a popular ECG instrument of the 1950s and 1960s. Vacuum tube technology.


The breakthrough came when Willem Einthoven, working in Leiden, The Netherlands, used the string galvanometer invented by him in 1901, which was much more sensitive than the capillary electrometer that Waller used.[10]
Einthoven assigned the letters P, Q, R, S and T to the various deflections, and described the electrocardiographic features of a number of cardiovascular disorders. In 1924, he was awarded the Nobel Prize in Medicine for his discovery.[11]
Though the basic principles of that era are still in use today, there have been many advances in electrocardiography over the years. The instrumentation, for example, has evolved from a cumbersome laboratory apparatus to compact electronic systems that often include computerized interpretation of the electrocardiogram.
ECG graph paper

A typical electrocardiograph runs at a paper speed of 25 mm/s, although faster paper speeds are occasionally used. Each small block of ECG paper is 1 mm². At a paper speed of 25 mm/s, one small block of ECG paper translates into 0.04 s (or 40 ms). Five small blocks make up 1 large block, which translates into 0.20 s (or 200 ms). Hence, there are 5 large blocks per second. A diagnostic quality 12 lead ECG is calibrated at 10 mm/mV, so 1 mm translates into 0.1 mV.
Filter selection
Modern ECG monitors offer multiple filters for signal processing. The most common settings are monitor mode and diagnostic mode. In monitor mode, the low frequency filter (also called the high-pass filter because signals above the threshold are allowed to pass) is set at either 0.5 Hz or 1 Hz and the high frequency filter (also called the low-pass filter because signals below the threshold are allowed to pass) is set at 40 Hz. This limits artifact for routine cardiac rhythm monitoring. The low frequency (high-pass) filter helps reduce wandering baseline and the high frequency (low pass) filter helps reduce 50 or 60 Hz power line noise (the power line network frequency differs between 50 and 60 Hz in different countries). In diagnostic mode, the low frequency (high pass) filter is set at 0.05 Hz, which allows accurate ST segments to be recorded. The high frequency (low pass) filter is set to 40, 100, or 150 Hz. Consequently, the monitor mode ECG display is more filtered than diagnostic mode, because its bandpass is narrower.[12]
Shown below is an image of electrocardiographic recording from a monitor set at 40Hz filter.

Leads

The word lead has two meanings in electrocardiography: it refers to either the wire that connects an electrode to the electrocardiograph, or (more commonly) to a combination of electrodes that form an imaginary line in the body along which the electrical signals are measured. Thus, the term loose lead artifact uses the former meaning, while the term 12 lead ECG uses the latter. In fact, a 12 lead electrocardiograph usually only uses 10 wires/electrodes. The latter definition of lead is the one used here.
An electrocardiogram is obtained by measuring electrical potential between various points of the body using a biomedical instrumentation amplifier. A lead records the electrical signals of the heart from a particular combination of recording electrodes which are placed at specific points on the patient's body.
- When a depolarization wavefront (or mean electrical vector) moves toward a positive electrode, it creates a positive deflection on the ECG in the corresponding lead.
- When a depolarization wavefront (or mean electrical vector) moves away from a positive electrode, it creates a negative deflection on the ECG in the corresponding lead.
- When a depolarization wavefront (or mean electrical vector) moves perpendicular to a positive electrode, it creates an equiphasic (or isoelectric) complex on the ECG. It will be positive as the depolarization wavefront (or mean electrical vector) approaches (A), and then become negative as it passes by (B).
There are two types of leads—unipolar and bipolar. The former have an indifferent electrode at the center of the Einthoven’s triangle (which can be likened to a ‘neutral’ of the wall socket) at zero potential. The direction of these leads is from the “center” of the heart radially outward and includes the precordial (chest) leads and limb leads— VL, VR, & VF. The latter, in contrast, have both the electrodes at some potential and the direction of the corresponding electrode is from the electrode at lower potential to the one at higher potential, e.g., in limb lead I, the direction is from left to right. These include the limb leads I, II, and III.
Note that the coloring scheme for leads varies by country.
Limb
Leads I, II and III are the so-called limb leads because at one time, the subjects of electrocardiography had to literally place their arms and legs in buckets of salt water in order to obtain signals for Einthoven's string galvanometer. They form the basis of what is known as Einthoven's triangle.[4] Eventually, electrodes were invented that could be placed directly on the patient's skin. Even though the buckets of salt water are no longer necessary, the electrodes are still placed on the patient's arms and legs to approximate the signals obtained with the buckets of salt water. They remain the first three leads of the modern 12 lead ECG.
- Lead I is a dipole with the negative (white) electrode on the right arm and the positive (black) electrode on the left arm.
- Lead II is a dipole with the negative (white) electrode on the right arm and the positive (red) electrode on the left leg.
- Lead III is a dipole with the negative (black) electrode on the left arm and the positive (red) electrode on the left leg.


Augmented limb
Leads aVR, aVL, and aVF are augmented limb leads. They are derived from the same three electrodes as leads I, II, and III. However, they view the heart from different angles (or vectors) because the negative electrode for these leads is a modification of Wilson's central terminal, which is derived by adding leads I, II, and III together and plugging them into the negative terminal of the EKG machine. This zeroes out the negative electrode and allows the positive electrode to become the "exploring electrode" or a unipolar lead. This is possible because Einthoven's Law states that I + (-II) + III = 0. The equation can also be written I + III = II. It is written this way (instead of I + II + III = 0) because Einthoven reversed the polarity of lead II in Einthoven's triangle, possibly because he liked to view upright QRS complexes. Wilson's central terminal paved the way for the development of the augmented limb leads aVR, aVL, aVF and the precordial leads V1, V2, V3, V4, V5, and V6.
- Lead aVR or "augmented vector right" has the positive electrode (white) on the right arm. The negative electrode is a combination of the left arm (black) electrode and the left leg (red) electrode, which "augments" the signal strength of the positive electrode on the right arm.
- Lead aVL or "augmented vector left" has the positive (black) electrode on the left arm. The negative electrode is a combination of the right arm (white) electrode and the left leg (red) electrode, which "augments" the signal strength of the positive electrode on the left arm.
- Lead aVF or "augmented vector foot" has the positive (red) electrode on the left leg. The negative electrode is a combination of the right arm (white) electrode and the left arm (black) electrode, which "augments" the signal of the positive electrode on the left leg.
The augmented limb leads aVR, aVL, and aVF are amplified in this way because the signal is too small to be useful when the negative electrode is Wilson's central terminal. Together with leads I, II, and III, augmented limb leads aVR, aVL, and aVF form the basis of the hexaxial reference system, which is used to calculate the heart's electrical axis in the frontal plane.
-
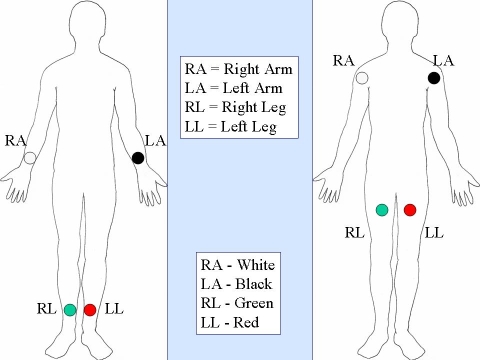
Proper placement of the limb leads.
-
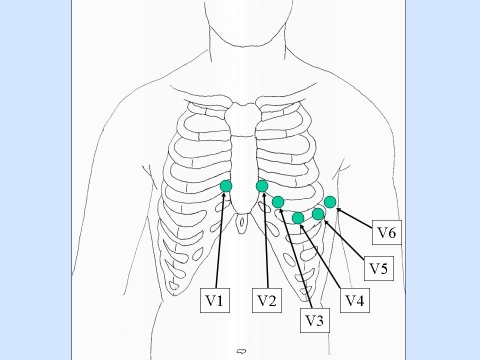
Proper placement of the precordial leads.


![[4]](http://nobelprize.org/medicine/educational/ecg/images/triangle.gif)
Precordial
The precordial leads V1, V2, V3, V4, V5, and V6 are placed directly on the chest. Because of their close proximity to the heart, they do not require augmentation. Wilson's central terminal is used for the negative electrode, and these leads are considered to be unipolar. The precordial leads view the heart's electrical activity in the so-called horizontal plane. The heart's electrical axis in the horizontal plane is referred to as the Z axis.
Leads V1, V2, and V3 are referred to as the right precordial leads and V4, V5, and V6 are referred to as the left precordial leads.
The QRS complex should be negative in lead V1 and positive in lead V6. The QRS complex should show a gradual transition from negative to positive between leads V2 and V4. The equiphasic lead is referred to as the transition lead. When the transition occurs earlier than lead V3, it is referred to as an early transition. When it occurs later than lead V3, it is referred to as a late transition. There should also be a gradual increase in the amplitude of the R wave between leads V1 and V4. This is known as R wave progression. Poor R wave progression is a nonspecific finding. It can be caused by conduction abnormalities, myocardial infarction, cardiomyopathy, and other pathological conditions.
- Lead V1 is placed in the fourth intercostal space to the right of the sternum.
- Lead V2 is placed in the fourth intercostal space to the left of the sternum.
- Lead V3 is placed directly between leads V2 and V4.
- Lead V4 is placed in the fifth intercostal space in the midclavicular line (even if the apex beat is displaced).
- Lead V5 is placed horizontally with V4 in the anterior axillary line
- Lead V6 is placed horizontally with V4 and V5 in the midaxillary line.
Ground
An additional electrode (usually green) is present in modern four-lead and twelve-lead ECGs. This is the ground lead and is placed on the right leg by convention, although in theory it can be placed anywhere on the body. With a three-lead ECG, when one dipole is viewed, the remaining lead becomes the ground lead by default.
Waves and intervals

A typical ECG tracing of a normal heartbeat (or cardiac cycle) consists of a P wave, a QRS complex and a T wave. A small U wave is normally visible in 50 to 75% of ECGs. The baseline voltage of the electrocardiogram is known as the isoelectric line. Typically the isoelectric line is measured as the portion of the tracing following the T wave and preceding the next P wave.
Rhythm analysis
There are some basic rules that can be followed to identify a patient's heart rhythm. What is the rate? Is it regular or irregular? Are P waves present? Are QRS complexes present? Is there a 1:1 relationship between P waves and QRS complexes? Is the PR interval constant?
P wave
During normal atrial depolarization, the main electrical vector is directed from the SA node towards the AV node, and spreads from the right atrium to the left atrium. This turns into the P wave on the ECG, which is upright in II, III, and aVF (since the general electrical activity is going toward the positive electrode in those leads), and inverted in aVR (since it is going away from the positive electrode for that lead). A P wave must be upright in leads II and aVF and inverted in lead aVR to designate a cardiac rhythm as Sinus Rhythm.
- The relationship between P waves and QRS complexes helps distinguish various cardiac arrhythmias.
- The shape and duration of the P waves may indicate atrial enlargement.
PR interval
The PR interval is measured from the beginning of the P wave to the beginning of the QRS complex. It is usually 120 to 200 ms long. On an ECG tracing, this corresponds to 3 to 5 small boxes.
- A prolonged PR interval may indicate a first degree heart block.
- A short PR interval may indicate a pre-excitation syndrome via an accessory pathway that leads to early activation of the ventricles, such as seen in Wolff-Parkinson-White syndrome.
- A variable PR interval may indicate other types of heart block.
- PR segment depression may indicate atrial injury or pericarditis.
- Variable morphologies of P waves in a single ECG lead is suggestive of an ectopic pacemaker rhythm such as wandering pacemaker or multifocal atrial tachycardia
QRS complex

The QRS complex is a structure on the ECG that corresponds to the depolarization of the ventricles. Because the ventricles contain more muscle mass than the atria, the QRS complex is larger than the P wave. In addition, because the His/Purkinje system coordinates the depolarization of the ventricles, the QRS complex tends to look "spiked" rather than rounded due to the increase in conduction velocity. A normal QRS complex is 0.06 to 0.10 sec (60 to 100 ms) in duration.
Not every QRS complex contains a Q wave, an R wave, and an S wave. By convention, any combination of these waves can be referred to as a QRS complex. However, correct interpretation of difficult ECGs requires exact labeling of the various waves. Some authors use lowercase and capital letters, depending on the relative size of each wave. For example, an Rs complex would be positively deflected, while a rS complex would be negatively deflected. If both complexes were labeled RS, it would be impossible to appreciate this distinction without viewing the actual ECG.
- The duration, amplitude, and morphology of the QRS complex is useful in diagnosing cardiac arrhythmias, conduction abnormalities, ventricular hypertrophy, myocardial infarction, electrolyte derangements, and other disease states.
- Q waves can be normal (physiological) or pathological. Normal Q waves, when present, represent depolarization of the interventricular septum. For this reason, they are referred to as septal Q waves, and can be appreciated in the lateral leads I, aVL, V5 and V6.
- Q waves greater than 1/3 the height of the R wave, greater than 0.04 sec (40 ms) in duration, or in the right precordial leads are considered to be abnormal, and may represent myocardial infarction.
ST segment
The ST segment connects the QRS complex and the T wave and has a duration of 0.08 to 0.12 sec (80 to 120 ms). It starts at the J point (junction between the QRS complex and ST segment) and ends at the beginning of the T wave. However, since it is usually difficult to determine exactly where the ST segment ends and the T wave begins, the relationship between the ST segment and T wave should be examined together. The typical ST segment duration is usually around 0.08 sec (80 ms). It should be essentially level with the PR and TP segment.
- The normal ST segment has a slight upward concavity.
- Flat, downsloping, or depressed ST segments may indicate coronary ischemia.
- ST segment elevation may indicate myocardial infarction. An elevation of >1mm and longer than 80 milliseconds following the J-point. This measure has a false positive rate of 15-20% (which is slightly higher in women than men) and a false negative rate of 20-30%.[13]
T wave
The T wave represents the repolarization (or recovery) of the ventricles. The interval from the beginning of the QRS complex to the apex of the T wave is referred to as the absolute refractory period. The last half of the T wave is referred to as the relative refractory period (or vulnerable period).
In most leads, the T wave is positive. However, a negative T wave is normal in lead aVR. Lead V1 may have a positive, negative, or biphasic T wave. In addition, it is not uncommon to have an isolated negative T wave in lead III, aVL, or aVF.
- Inverted (or negative) T waves can be a sign of coronary ischemia, Wellens' syndrome, left ventricular hypertrophy, or CNS disorder.
- Tall or "tented" symmetrical T waves may indicate hyperkalemia. Flat T waves may indicate coronary ischemia or hypokalemia.
- The earliest electrocardiographic finding of acute myocardial infarction is sometimes the hyperacute T wave, which can be distinguished from hyperkalemia by the broad base and slight asymmetry.
- When a conduction abnormality (e.g., bundle branch block, paced rhythm) is present, the T wave should be deflected opposite the terminal deflection of the QRS complex. This is known as appropriate T wave discordance.
QT interval
The QT interval is measured from the beginning of the QRS complex to the end of the T wave. A normal QT interval is usually about 0.40 seconds. The QT interval as well as the corrected QT interval are important in the diagnosis of long QT syndrome and short QT syndrome. The QT interval varies based on the heart rate, and various correction factors have been developed to correct the QT interval for the heart rate.
The most commonly used method for correcting the QT interval for rate is the one formulated by Bazett and published in 1920.[14] Bazett's formula is <math>QTc = \frac{QT}{\sqrt {RR} }</math>, where QTc is the QT interval corrected for rate, and RR is the interval from the onset of one QRS complex to the onset of the next QRS complex, measured in seconds. However, this formula tends to be inaccurate, and over-corrects at high heart rates and under-corrects at low heart rates.
U wave
The U wave is not always seen. It is typically small, and, by definition, follows the T wave. U waves are thought to represent repolarization of the papillary muscles or Purkinje fibers. Prominent U waves are most often seen in hypokalemia, but may be present in hypercalcemia, thyrotoxicosis, or exposure to digitalis, epinephrine, and Class 1A and 3 antiarrhythmics, as well as in congenital long QT syndrome and in the setting of intracranial hemorrhage. An inverted U wave may represent myocardial ischemia or left ventricular volume overload.[15]
Clinical lead groups

There are twelve leads in total, each recording the electrical activity of the heart from a different perspective, which also correlate to different anatomical areas of the heart for the purpose of identifying acute coronary ischemia or injury. Two leads that look at the same anatomical area of the heart are said to be contiguous (see color coded chart).
- The inferior leads (leads II, III and aVF) look at electrical activity from the vantage point of the inferior (or diaphragmatic) wall of the left ventricle.
- The lateral leads (I, aVL, V5 and V6) look at the electrical activity from the vantage point of the lateral wall of left ventricle. Because the positive electrode for leads I and aVL are located on the left shoulder, leads I and aVL are sometimes referred to as the high lateral leads. Because the positive electrodes for leads V5 and V6 are on the patient's chest, they are sometimes referred to as the low lateral leads.
- The septal leads, V1 and V2 look at electrical activity from the vantage point of the septal wall of the left ventricle. They are often grouped together with the anterior leads.
- The anterior leads, V3 and V4 look at electrical activity from the vantage point of the anterior wall of the left ventricle.
- In addition, any two precordial leads that are next to one another are considered to be contiguous. For example, even though V4 is an anterior lead and V5 is a lateral lead, they are contiguous because they are next to one another.
- Lead aVR offers no specific view of the left ventricle. Rather, it views the inside of the endocardial wall from its perspective on the right shoulder.
Axis

The heart's electrical axis refers to the general direction of the heart's depolarization wavefront (or mean electrical vector) in the frontal plane. It is usually oriented in a right shoulder to left leg direction, which corresponds to the left inferior quadrant of the hexaxial reference system, although -30o to +90o is considered to be normal.
- Left axis deviation (-30o to -90o) may indicate left anterior fascicular block or Q waves from inferior MI.
- Right axis deviation (+90o to +180o) may indicate left posterior fascicular block, Q waves from high lateral MI, or a right ventricular strain pattern.
- In the setting of right bundle branch block, right or left axis deviation may indicate bifascicular block.
Representation in culture
The ECG has become so familiar to the general population that it is part of the logo of many medical organizations, representing the technical side of medicine vs. the Rod of Asclepius or caduceus, which are more traditional. Being an electrical representation, it signifies vitality and urgency.
In various television medical dramas, an isoelectric ECG (no cardiac electrical activity, also known as flatline) is often used as a symbol of death or at least extreme medical peril. This is technically known as asystole, a form of cardiac arrest with a particularly bad prognosis. Though sometimes shown on television, defibrillation, which can be used to correct arrythmias such as ventricular fibrillation and pulseless ventricular tachycardia, does not correct asystole and is not an indicated therapy.
The Digital Imperative
Recent regulatory developments have thrust cardiac safety to the forefront of clinical development due to the fact that QT effects of new drugs is now the most common cause of drug withdrawal from the market and delays in or lack of regulatory approval for marketing. The resultant "Digital ECG Imperative for Cardiac Safety" requires innovative strategies on the part of both drug development organizations and ECG services providers.
On November 15, 2002, the FDA and Health Canada published regulatory guidance in the form of a concept paper entitled The Clinical Evaluation of QT/QTc Interval Prolongation and Proarrhythmic Potential for Non-Antiarrhythmic Drugs, which was reviewed and discussed on January 13-14, 2003.
Overall, the new regulatory guidance on ECGs in clinical research will require more robust and uniform cardiac safety assessments across virtually all segments of the drug development industry. It will drive increased reliance on ECG core laboratories. In turn, such laboratories will need to respond with not only increased capacity and capability, but also an enhancement of methodologies employed. While scientific expertise will remain of prime importance, core ECG laboratories will need to demonstrate mastery in new core competencies of a technical and logistical nature.
Related Chapters
- Advanced cardiac life support (ACLS)
- Ballistocardiograph
- Cardiac cycle
- Electrical conduction system of the heart
- Electrocardiogram technician
- Electroencephalography
- Electrogastrogram
- Electroretinography
- Heart rate monitor
- Holter monitor
- Myocardial infarction
Sources
- ECGpedia
- ECGpedia: Course for interpretation of ECG
- The whole ECG - A really basic ECG primer
- 12-lead ECG library
- Simulation tool to demonstrate and study the relation between the electric activity of the heart and the ECG
- ECG information from Children's Hospital Heart Center, Seattle.
- ECG Challenge from the ACC D2B Initiative
- ECG simulator
- National Heart, Lung, and Blood Institute, Diseases and Conditions Index
- Digital Imperative
- A summarized extensive history of electrocardiography
- Interpretation of electrocardiograms in infants and children.
References
- ↑ Braunwald E. (Editor), Heart Disease: A Textbook of Cardiovascular Medicine, Fifth Edition, p. 108, Philadelphia, W.B. Saunders Co., 1997. ISBN 0-7216-5666-8.
- ↑ "2005 American Heart Association Guidelines for Cardiopulmonary Resuscitation and Emergency Cardiovascular Care - Part 8: Stabilization of the Patient With Acute Coronary Syndromes." Circulation 2005; 112: IV-89 - IV-110.
- ↑ 3.0 3.1 "The clinical value of the ECG in noncardiac conditions." Chest 2004; 125(4): 1561-76. PMID 15078775
- ↑ Braunwald E. (Editor), Heart Disease: A Textbook of Cardiovascular Medicine, Fifth Edition, p. 119-123, Philadelphia, W.B. Saunders Co., 1997. ISBN 0-7216-5666-8.
- ↑ Braunwald E. (Editor), Heart Disease: A Textbook of Cardiovascular Medicine, Fifth Edition, p. 153-176, Philadelphia, W.B. Saunders Co., 1997. ISBN 0-7216-5666-8.
- ↑ O'Keefe J, Zinsmeister A, Gibbons R (1989). "Value of normal electrocardiographic findings in predicting resting left ventricular function in patients with chest pain and suspected coronary artery disease". Am J Med. 86 (6 Pt 1): 658–62. PMID 2729316.
- ↑ Ronald M. Birse, rev. Patricia E. Knowlden [1] Oxford Dictionary of National Biography 2004 (Subscription required)
- ↑ Burdon Sanderson J (1878). "Experimental results relating to the rhythmical and excitatory motions of the ventricle of the frog heart". Proc Roy Soc Lond. 27: 410&ndash, 14.
- ↑ Waller AD (1887). "A demonstration on man of electromotive changes accompanying the heart's beat". J Physiol (Lond). 8: 229&ndash, 34.
- ↑ Einthoven W. Un nouveau galvanometre. Arch Neerl Sc Ex Nat 1901; 6:625
- ↑ Cooper J (1986). "Electrocardiography 100 years ago. Origins, pioneers, and contributors". N Engl J Med. 315 (7): 461–4. PMID 3526152.
- ↑ Mark JB "Atlas of Cardiovascular Monitoring." p. 130. New York: Churchill Livingstone, 1998. ISBN 0-443-08891-8.
- ↑ Sabatine MS (2000). Pocket Medicine (Pocket Notebook). Lippincott Williams & Wilkins. ISBN 0-7817-1649-7.
- ↑ Bazett HC (1920). "An analysis of the time-relations of electrocardiograms". Heart. 7: 353&ndash, 70.
- ↑ Conrath C, Opthof T (2005). "The patient U wave". Cardiovasc Res. 67 (2): 184–6. PMID 15979057.
ar:رسم قلب كهربائي
zh-min-nan:Sim-tiān-tô͘
cs:Elektrokardiogram
da:Elektrokardiogram
de:Elektrokardiogramm
eu:Elektrokardiograma
gl:Electrocardiograma
hr:Elektrokardiogram
it:Elettrocardiogramma
he:אלקטרוקרדיוגרם
ku:EKG
lb:Elektrokardiogramm
lt:Elektrokardiografija
hu:Elektrokardiográfia
nl:Elektrocardiogram
no:Elektrokardiogram
nn:Elektrokardiografi
sq:Elektrokardiografia
fi:EKG
sv:EKG
uk:Електрокардіографія