Long QT Syndrome electrocardiogram
|
Long QT Syndrome Microchapters |
|
Diagnosis |
|---|
|
Treatment |
|
Case Studies |
|
Long QT Syndrome electrocardiogram On the Web |
|
American Roentgen Ray Society Images of Long QT Syndrome electrocardiogram |
|
Risk calculators and risk factors for Long QT Syndrome electrocardiogram |
Editor-In-Chief: C. Michael Gibson, M.S., M.D. [2]
Overview
The diagnosis of LQTS is difficult in so far as 2.5% of the healthy population have a prolonged QT interval, and 10% of LQTS patients have a normal QT interval (known as concealed LQTs). The presence of LQTs in the absence of QT prolongation (concealed LQTs) underscores the importance of genetic testing in the diagnosis of LQTs. It should be noted that the QT interval is often overestimated in the presence of a u wave.
How to Measure the QT
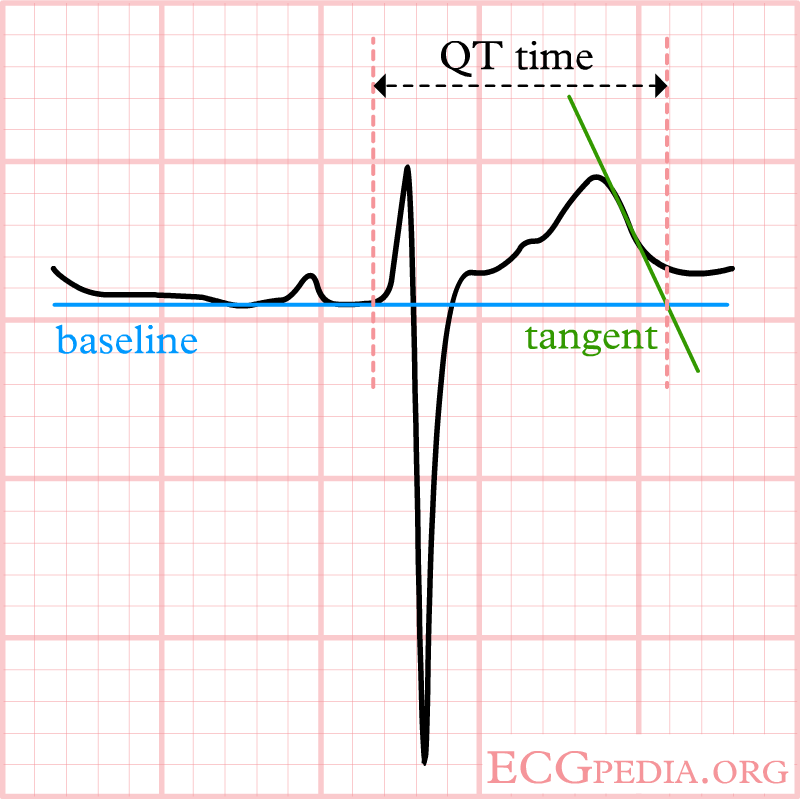
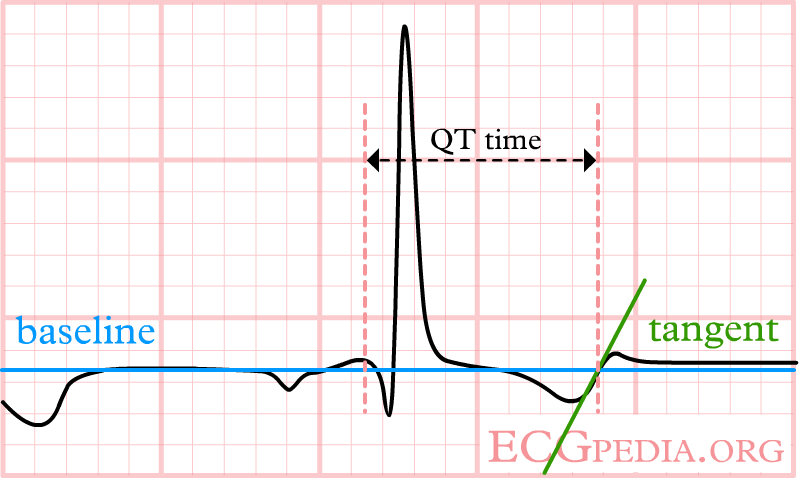
The QT interval is often measured incorrectly. It is measured incorrectly by 33% of EP physicians and 75% of general cardiologists. It is measured incorrectly by <5% of Long QT syndrome experts who deal with this on a frequent basis. [1] The presence of a U wave can often lead to a false diagnosis of QT prolongation. In order to avoid this, the "teach the tangent" or "avoid the tail" rule is applied. In this method, a line is drawn on top of the downslope of the T wave as shown below with the dotted green line. The QT interval is measured where this green dotted line intersects with the isoelectric line as shown by the large green arrow. The red arrow is an incorrect assessment of the QT interval at the end of the U wave. Using the red arrow would lead to a misdiagnosis of QT prolongation.

The LQTS Diagnostic Score
A commonly used criterion to diagnose LQTS is the LQTS "diagnostic score". Its based on several criteria giving points to each. With 4 or more points the probability is high for LQTS, and with 1 or less point the probability is low. Two or 3 points indicates intermediate probability.
- QTc (Defined as QT interval / square root of RR interval)
- >= 480 msec - 3 points
- 460-470 msec - 2 points
- 450 msec and male gender - 1 point
- Torsades de Pointes ventricular tachycardia - 2 points
- T wave alternans - 1 point
- Notched T wave in at least 3 leads - 1 point
- Low heart rate for age (children) - 0.5 points
- Syncope (one cannot receive points both for syncope and Torsades de pointes)
- With stress - 2 points
- Without stress - 1 point
- Congenital deafness - 0.5 points
- Family history (the same family member cannot be counted for LQTS and sudden death)
- Other family members with definite LQTS - 1 point
- Sudden death in immediate family (members before the age 30) - 0.5 points
Electrocardiographic Examples of the Long QT Variants
Shown below are examples of ECGs demonstrating QT prolongation in Long QT syndrome.
- LQT 1 shows 'early onset' broad based, slowly generated T waves
- LQT 2 shows small late T waves. Sometimes these T waves will be notched or double humped in lead V4.
- LQT 3 shows a flat and prolonged ST segment with a 'late onset' T wave that is normal in configuration.

Electrocardiographic Examples
-
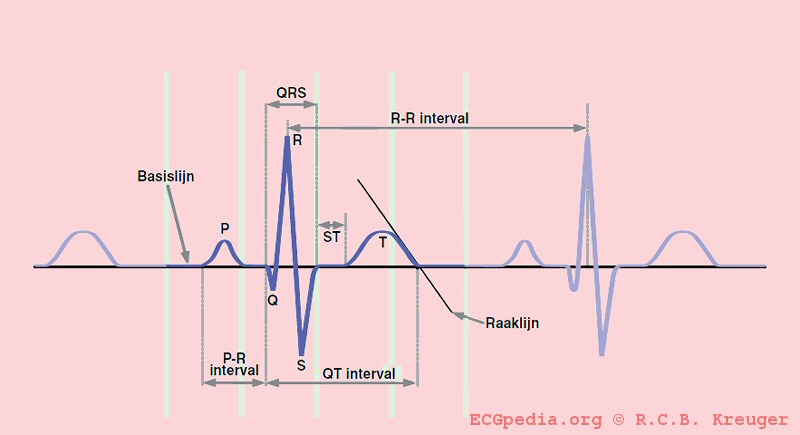 The QT interval start at the onset of the Q wave and ends where the tangent line for the steepest part of the T wave intersects with the baseline of the ECG.
 -
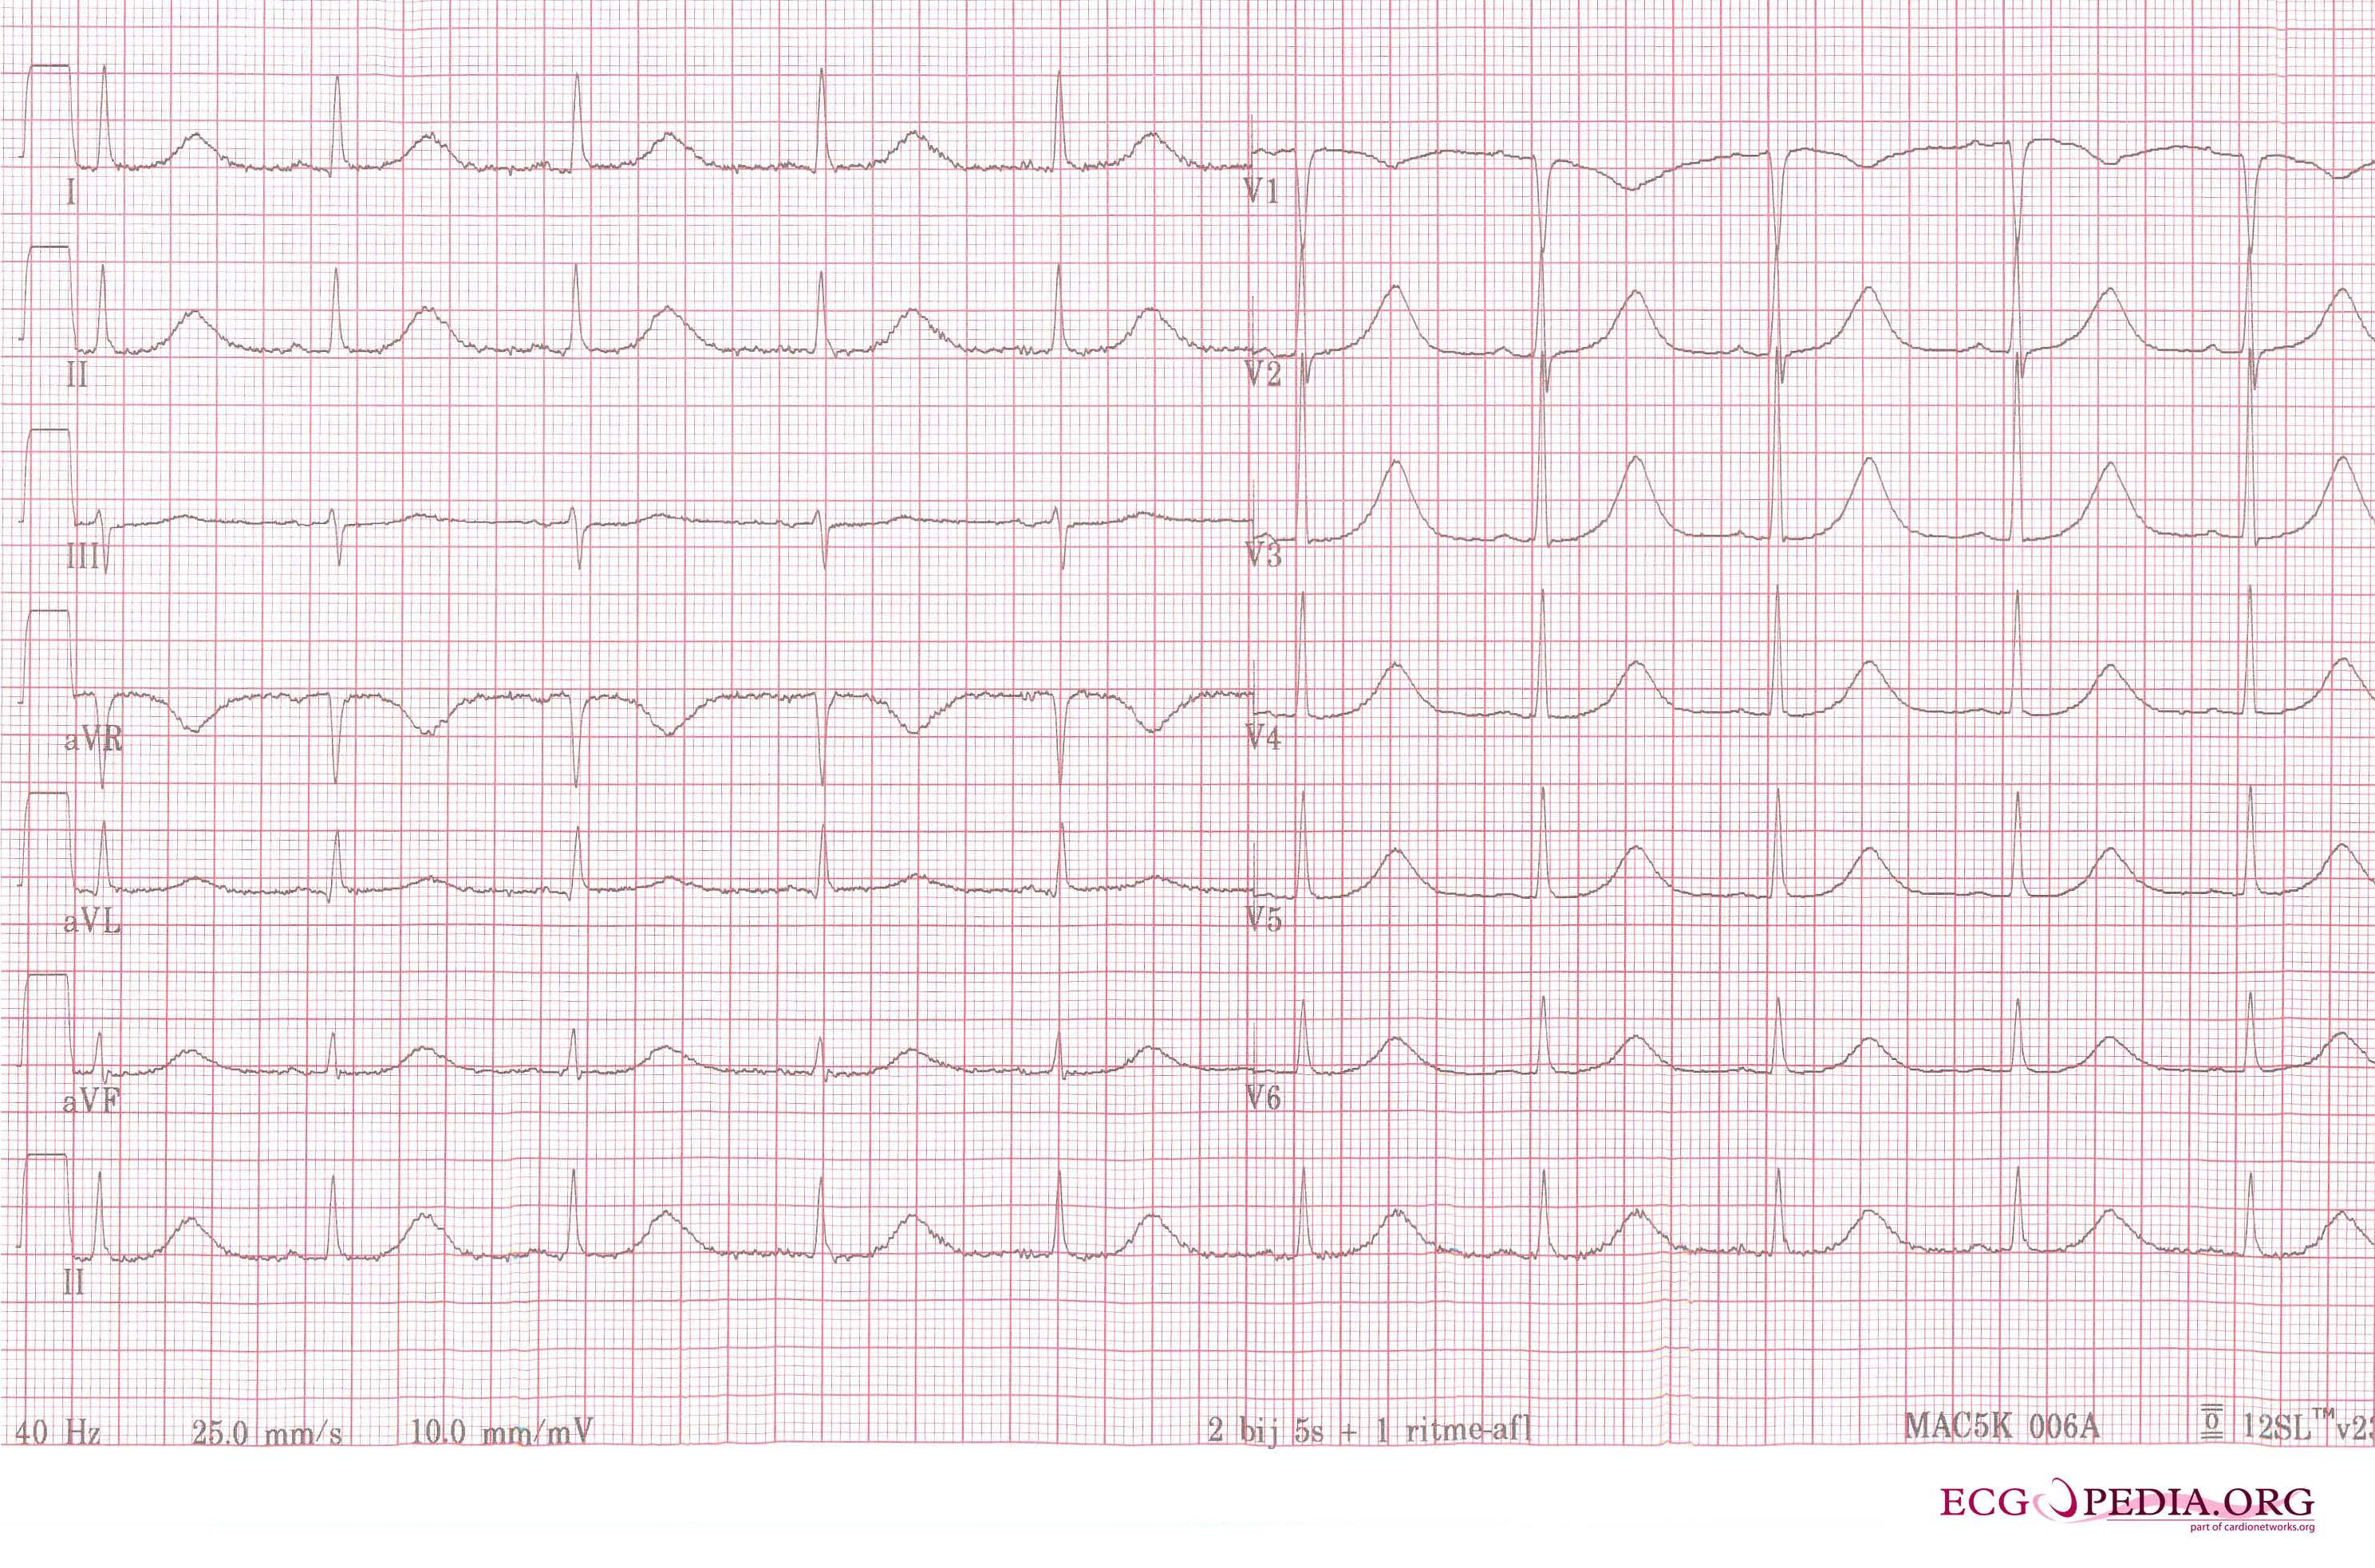 A 12 lead ECG of a patient with acquired long QT syndrome. Notice the QT prolongation. The QTc is about 640ms.
 -
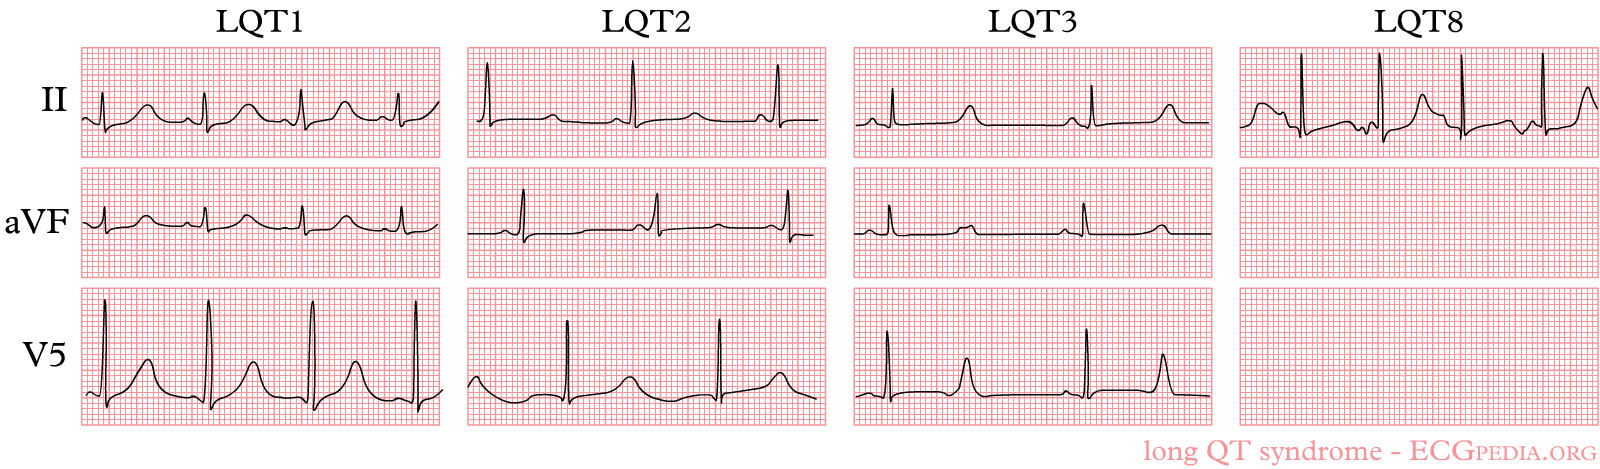 The three most common forms of LQTS can be recognized by the characteristic ECG abnormalities


-
 The ECG does not meet the baseline after the end of the T wave. Still, the crossing of the tangent and baseline should be used for measurements.
 -
 A bifasic T wave. The tangent to the 'hump' with the largest amplitude is chosen. This can change from beat to beat, making it more important to average several measurements.
 -
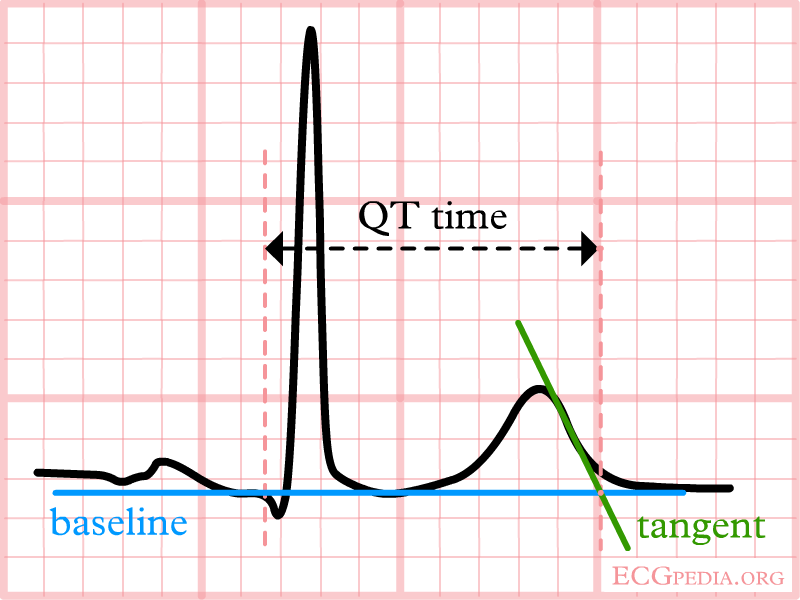 The T wave is broad, but the tangent crosses the baseline before the T wave joins the baseline. The QT interval would be overestimated when this last definition of the end of the T wave would be used.


References
- ↑ Heart Rhythm 2005;2:569-574