Left bundle branch block EKG examples
|
Left bundle branch block Microchapters |
|
Differentiating Left Bundle Branch Block from other Diseases |
|---|
|
Diagnosis |
|
Treatment |
|
Case Studies |
|
Left bundle branch block EKG examples On the Web |
|
American Roentgen Ray Society Images of Left bundle branch block EKG examples |
|
Risk calculators and risk factors for Left bundle branch block EKG examples |
Editor-In-Chief: C. Michael Gibson, M.S., M.D. [1]; Associate Editor(s)-in-Chief: Cafer Zorkun, M.D., Ph.D. [2]
For the main page on Left Bundle Branch Block, click here.
EKG Examples
Shown below is an EKG with an RsR' pattern (M pattern)in leads V5, V6, and aVL depicting a left bundle branch block. There is also notching of the QRS complex in lead I and ST segment elevation seen in leads V1, V2, V3, V4, and aVR.
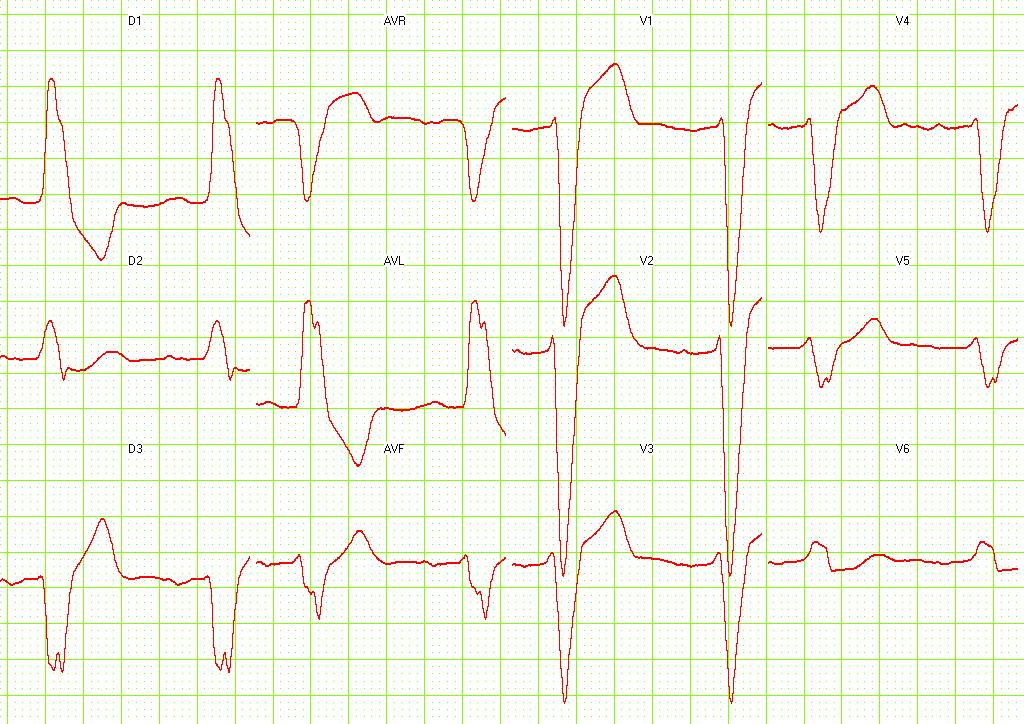
Copyleft image obtained courtesy of ECGpedia, http://en.ecgpedia.org/wiki/Main_Page
Shown below is an EKG with an RsR' pattern (M pattern) in leads II, aVL, and aVF depicting a left bundle branch block. There is also ST segment elevation in leads V1, V2, and aVR. There is widening of the QRS complexes throughout the precordial leads.
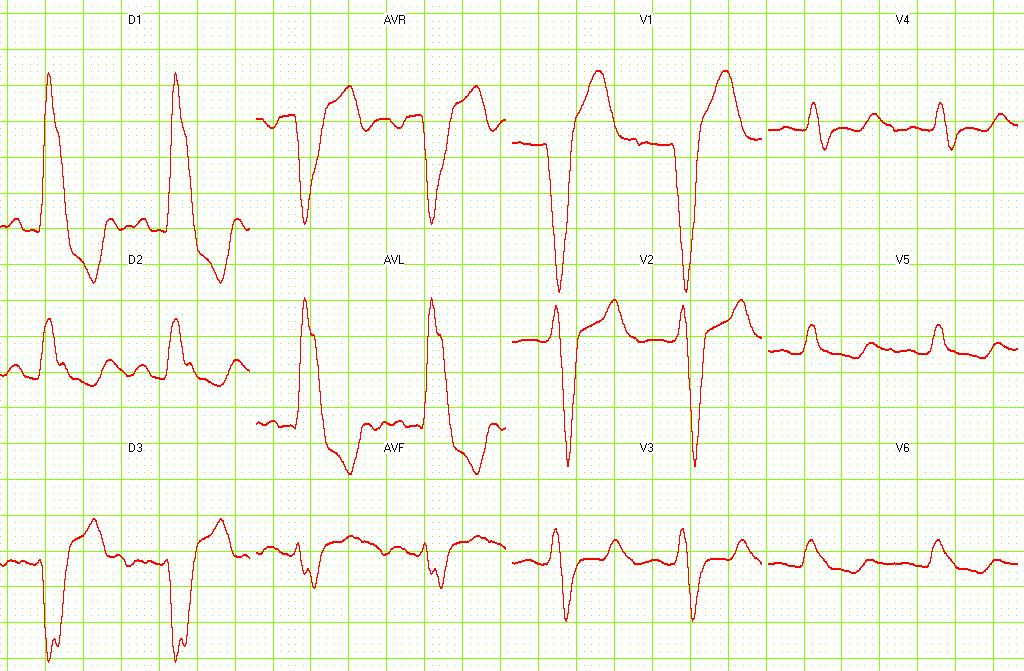
Copyleft image obtained courtesy of ECGpedia, http://en.ecgpedia.org/wiki/Main_Page
Shown below is an EKG with an RsR' pattern (M pattern) in leads I, II, aVL, and V4 depicting a left bundle branch block. The EKG also shows left axis deviation with left ventricular hypertrophy, and ST segment elevations in V1, V2, and V3 as well as an ST segment depression in V6. There is widening of the QRS complexes throughout the precordial leads.
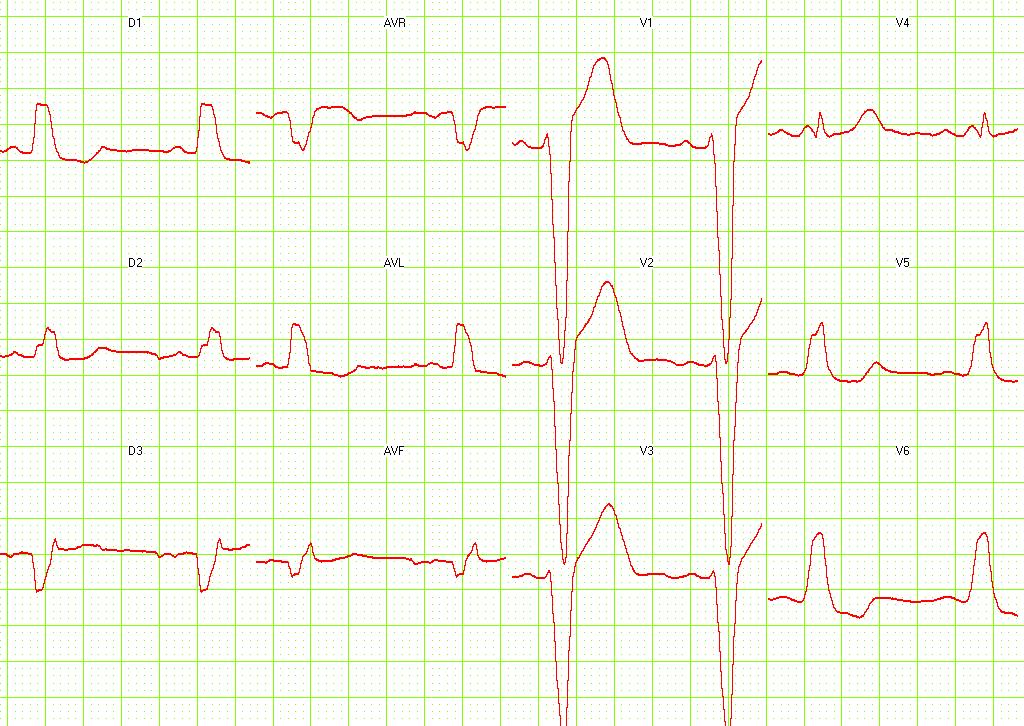
Copyleft image obtained courtesy of ECGpedia, http://en.ecgpedia.org/wiki/Main_Page
Shown below is an EKG with an RsR' pattern (M pattern) in leads V1, V4, V5, and aVL depicting a left bundle branch block. The EKG also shows ST depression with T wave inversion in lead V6 indicating a left ventricular strain pattern. Wide QRS complexes are seen throughout the EKG. The EKG also shows evidence of left ventricular hypertrophy.
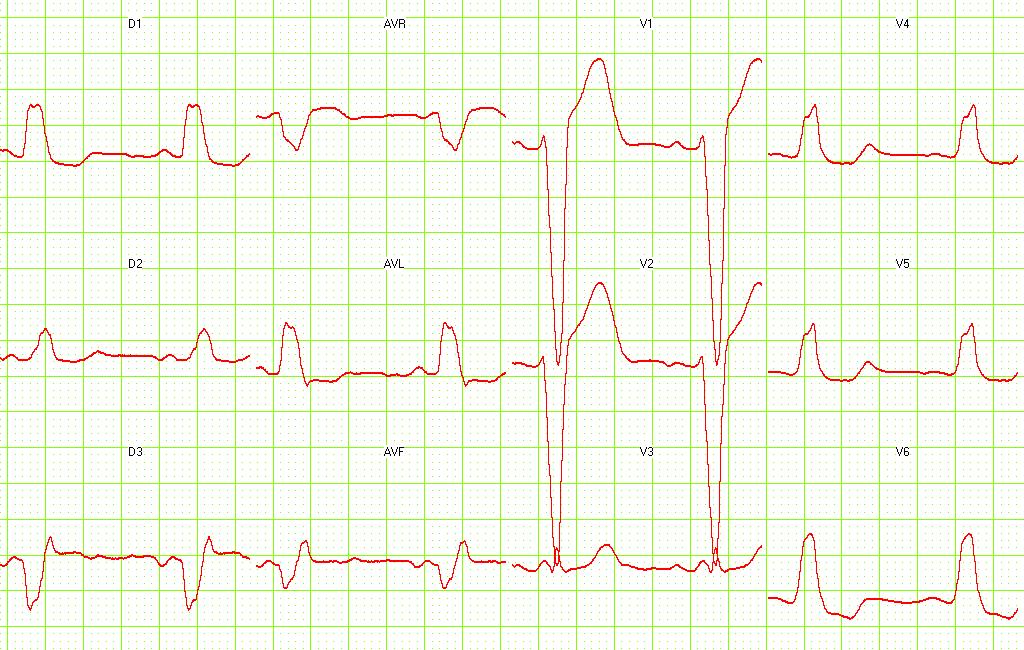
Copyleft image obtained courtesy of ECGpedia, http://en.ecgpedia.org/wiki/Main_Page
Shown below is an EKG with an RsR' pattern (M pattern) in leads III, aVL, aVF, and notching of the QRS complex in V5 depicting a left bundle branch block. Wide QRS complexes are seen throughout the EKG.

Copyleft image obtained courtesy of ECGpedia, http://en.ecgpedia.org/wiki/Main_Page
Shown below is an EKG with an irregular rhythm and an RsR' pattern (M pattern) in leads II, V5, and V6. Q waves are seen in leads I, aVL, V5, and V6. There is evidence of left ventricular hypertrophy and left axis deviation.
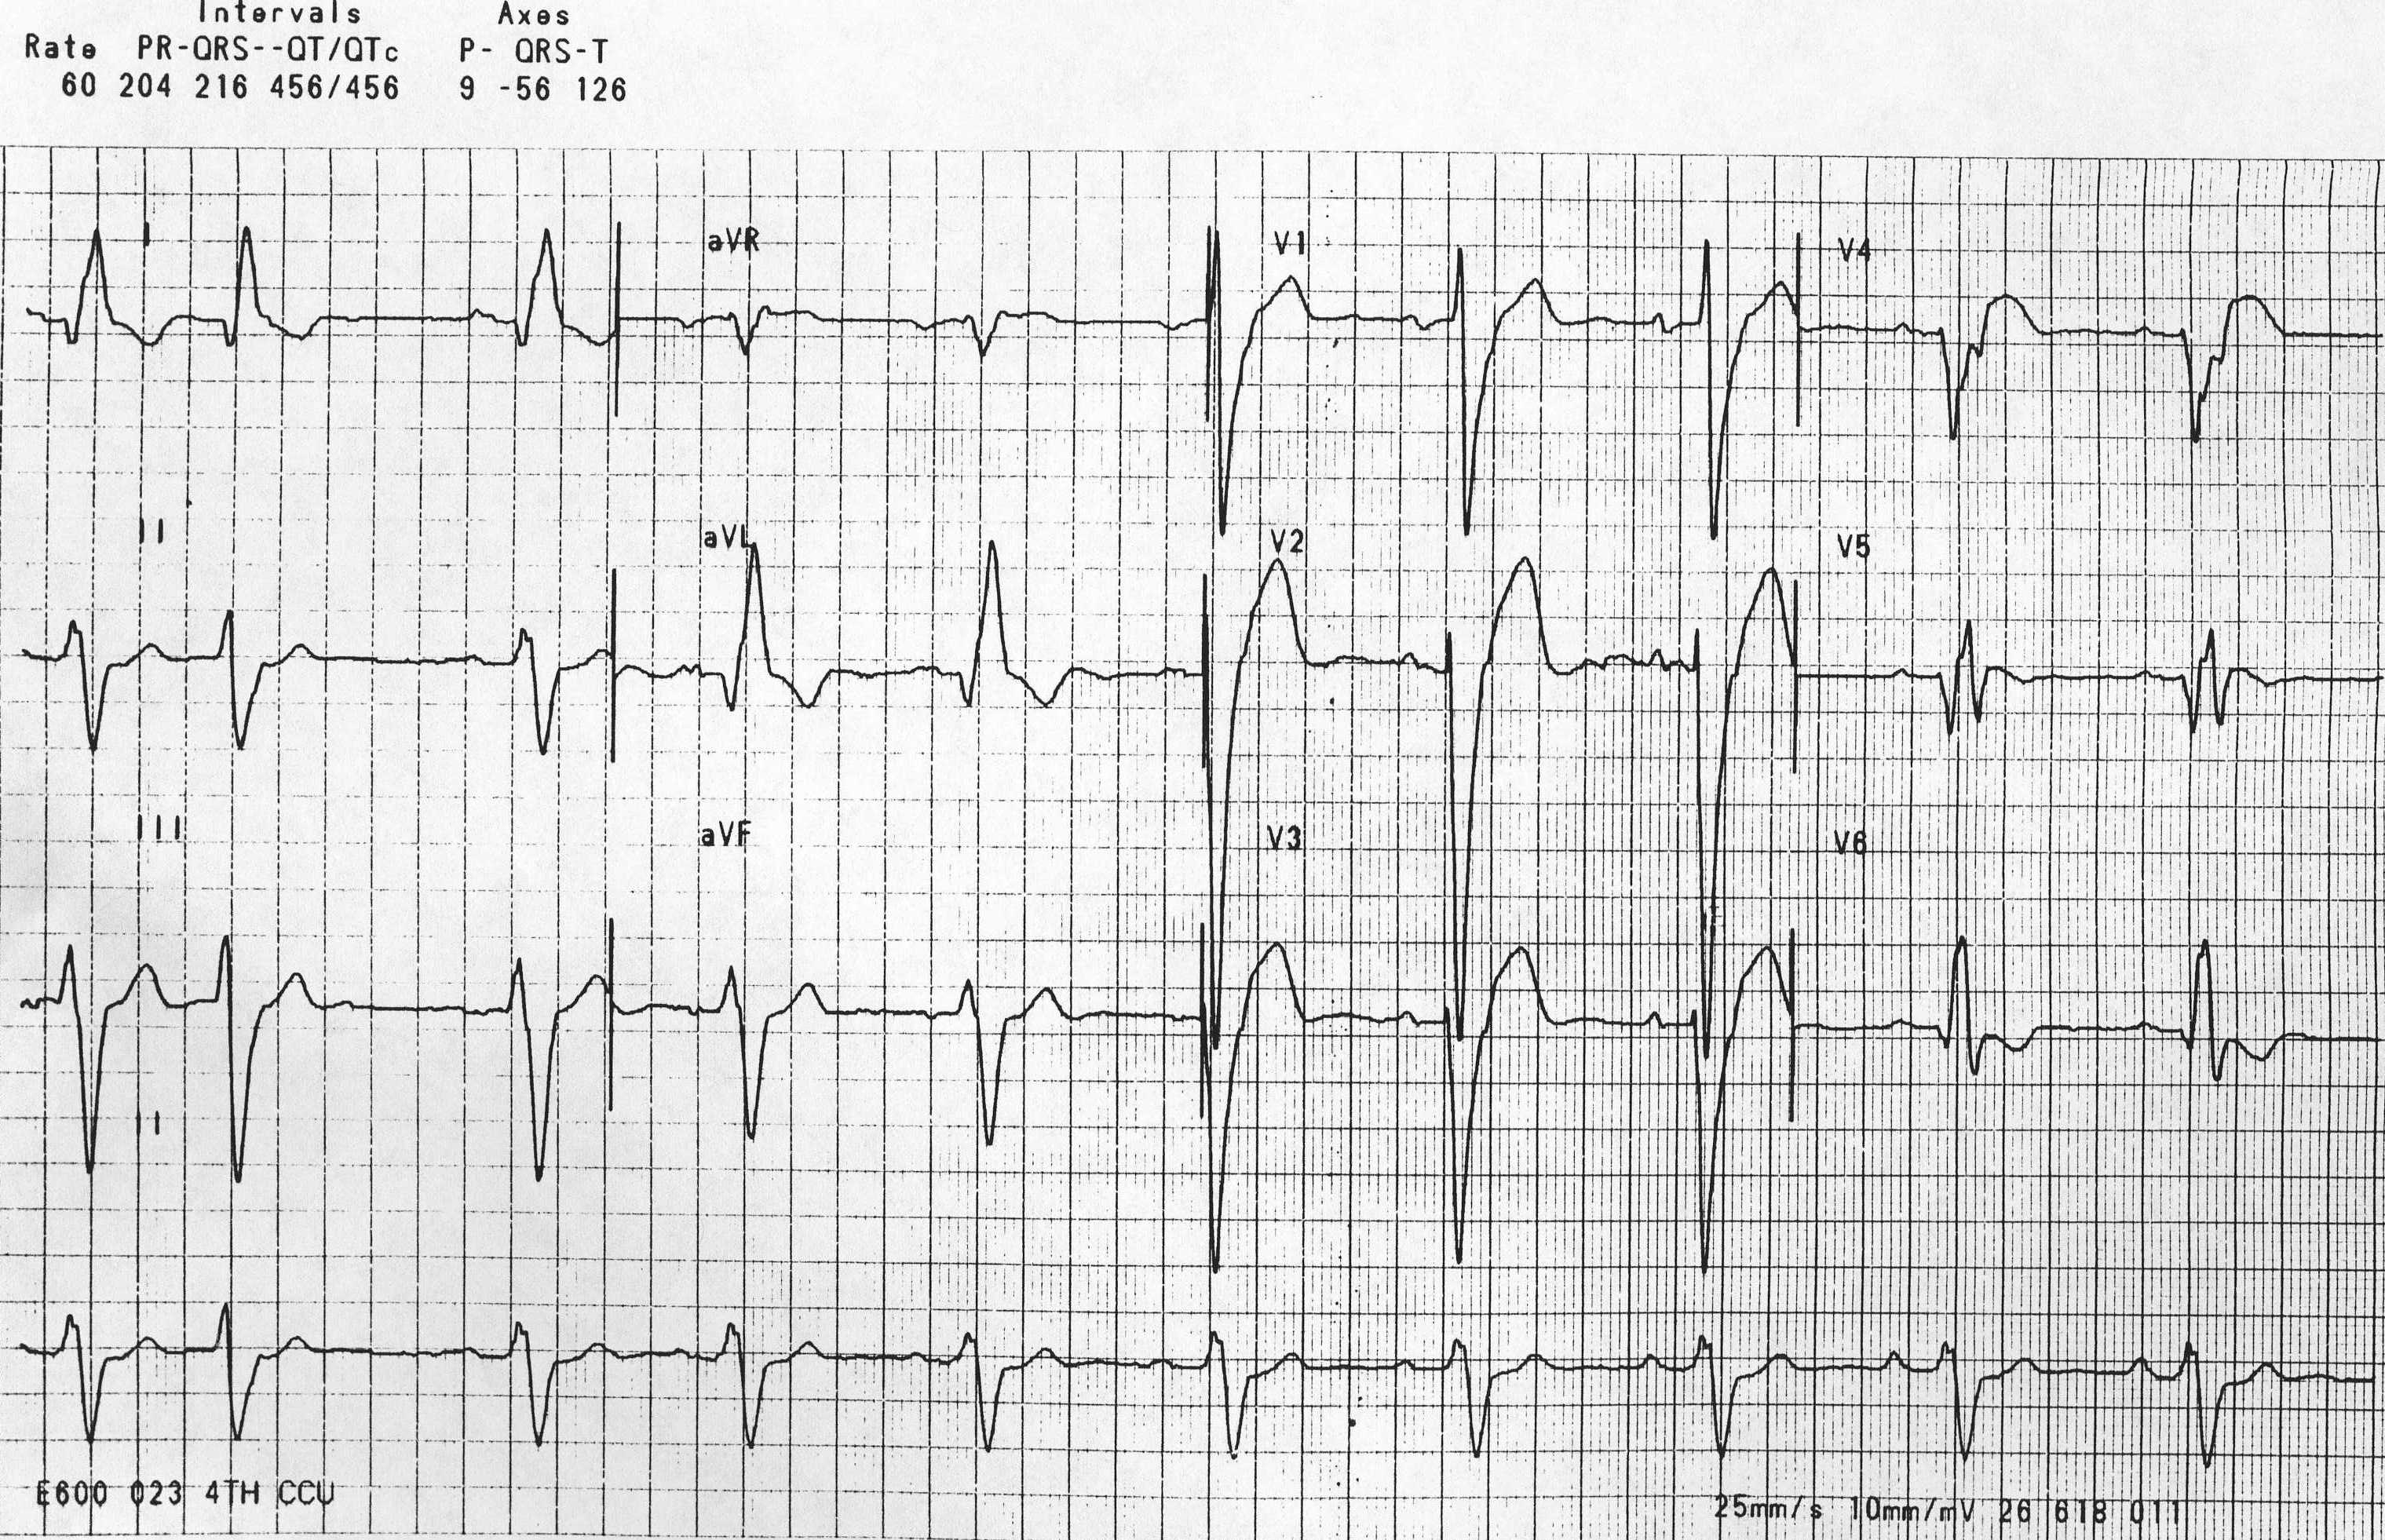
Copyleft image obtained courtesy of ECGpedia, http://en.ecgpedia.org/wiki/Main_Page
Shown below is an EKG with a left bundle branch block.
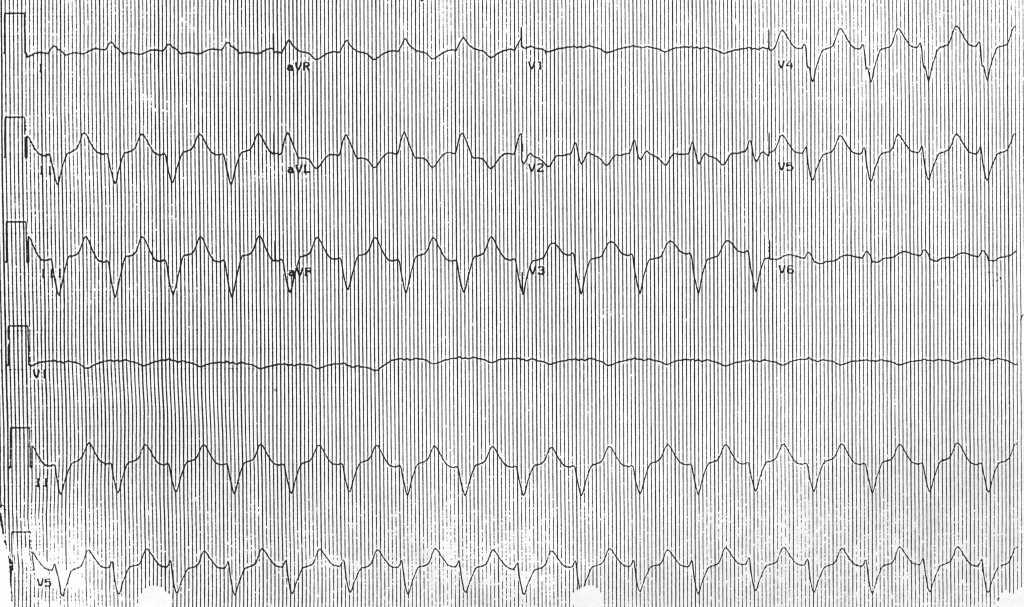
Copyleft image obtained courtesy of ECGpedia, http://en.ecgpedia.org/wiki/Main_Page
Shown below is an EKG with an RsR' pattern (M pattern) in leads V4 and V5 depicting a left bundle branch block. The EKG also shows sinus rhythm, prolonged PR interval (greater than 200ms), and wide QRS complexes (> 120ms). The loss of the septal Q waves and the tall broad R waves in leads I, aVL, and V6 are diagnostic of a left bundle branch block.
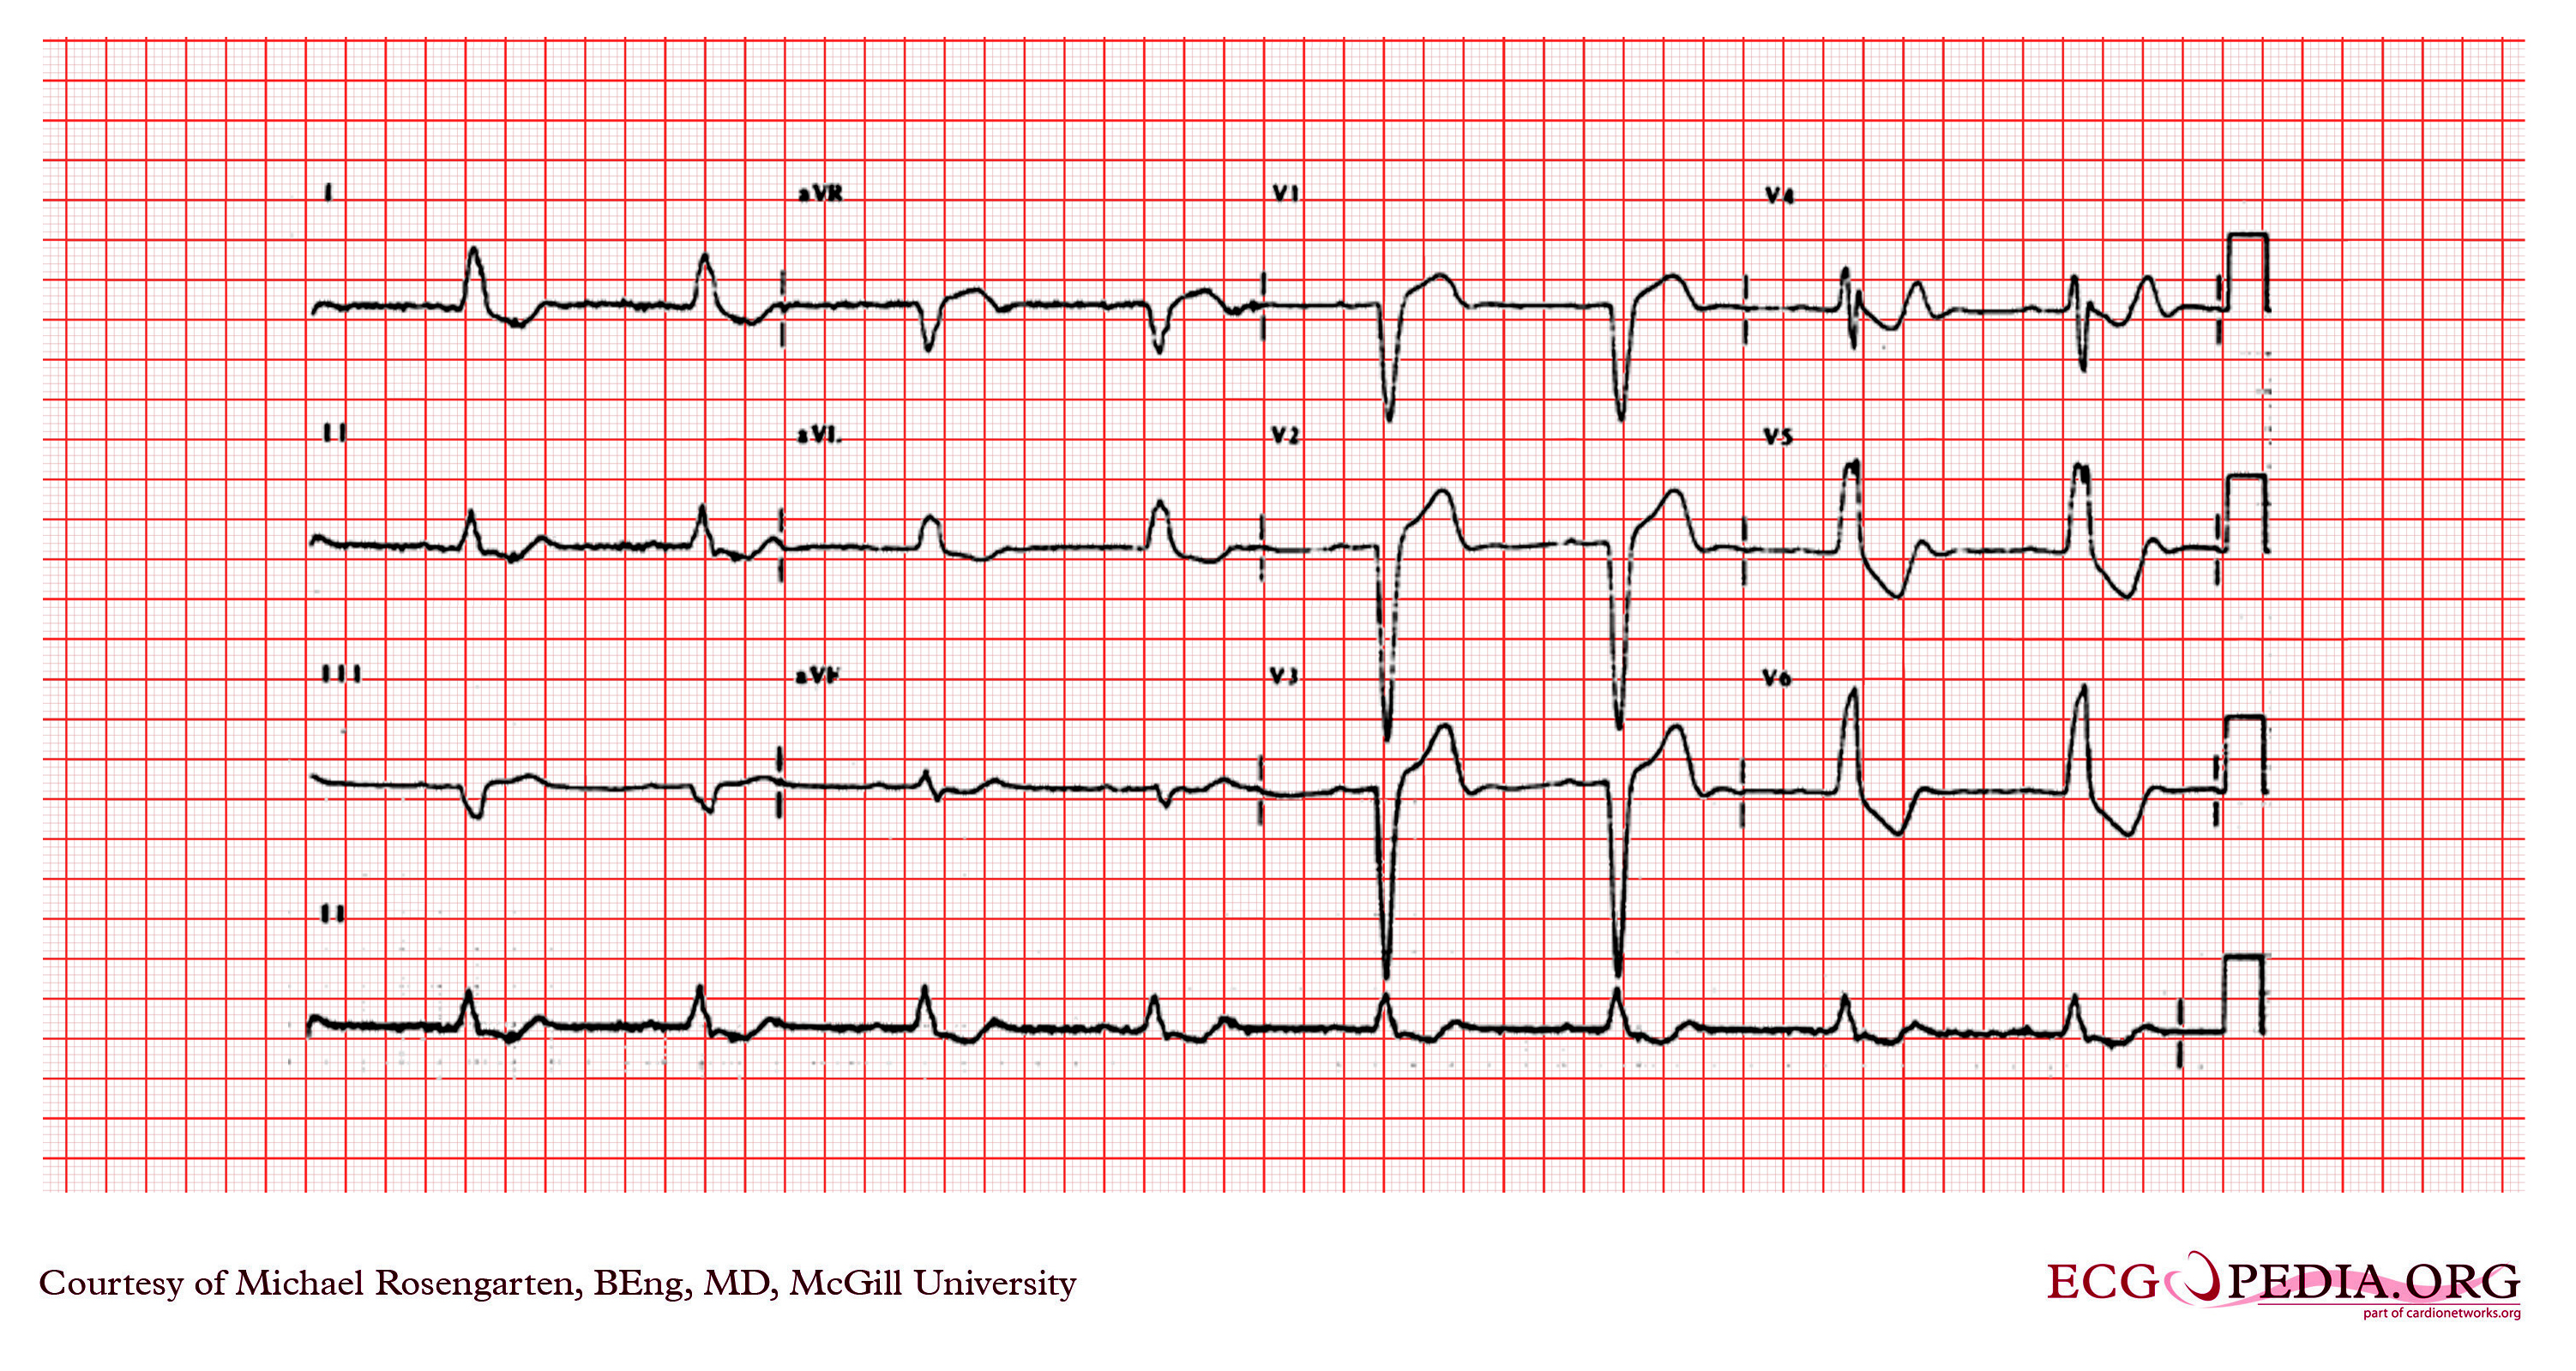
Copyleft image obtained courtesy of ECGpedia, http://en.ecgpedia.org/wiki/File:E203.jpg