Left bundle branch block: Difference between revisions
No edit summary |
|||
| Line 225: | Line 225: | ||
Below is an electrocardiogram of left bundle branch block. | Below is an electrocardiogram of left bundle branch block. | ||
[[File:LBBB.CMG.jpg|center|800px]] | [[File:LBBB.CMG.jpg|center|800px]] | ||
---- | |||
The recording below shows sinus rhythm but the [[PR interval]] is prolonged (greater than 200ms) and the QRS is wide (> 120ms). The loss of the septal Q waves and the tall broad R waves in leads I, aVL and V6 are diagnostic of a left bundle branch block. | |||
[[File:Left bundle branch block17.jpg|center|800px]] | |||
---- | ---- | ||
Revision as of 15:54, 16 October 2012
| Left bundle branch block | |
 | |
|---|---|
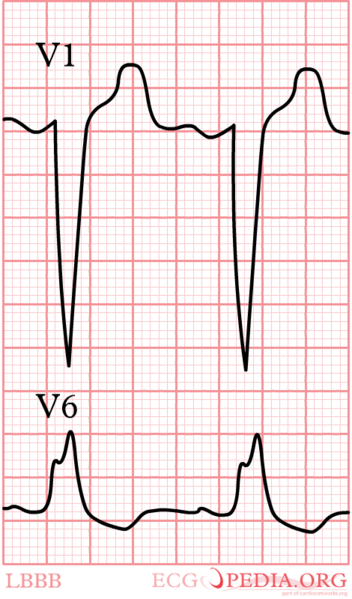
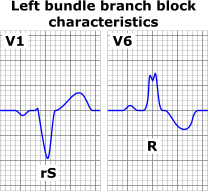
| ECG characteristics of a typical LBBB showing wide QRS complexes with abnormal morphology in leads V1 and V6 | |
| ICD-10 | I44.7 |
| DiseasesDB | 7352 |
Editor-In-Chief: C. Michael Gibson, M.S., M.D. [1]; Associate Editor(s)-In-Chief: Cafer Zorkun, M.D., Ph.D. [2]; Atif Mohammad, M.D.
Synonyms and related keywords: LBBB
Overview
Left bundle branch block (LBBB) is a cardiac conduction abnormality seen on the electrocardiogram (ECG) whereby there is an impairment of transmission of the cardiac electrical impulse along the fibers of the left main bundle branch, or both the left anterior fascicle and left posterior fascicle. This conduction disturbance is characterized by wide (greater than or equal to 0.12 seconds) QRS complexes. In this condition, activation of the left ventricle is delayed, which results in the left ventricle contracting later than the right ventricle.
Classification
New Left Bundle Branch Block
New LBBB is defined as the presence of a new left bundle branch block and:[1]
- A prior ECG with normal QRS duration (<110 ms)12 within 24 hours before the LBBB tracing without T-wave abnormalities.
- Acute-onset illness with LBBB on the admission tracing resolving within 24 hours without T-wave abnormalities on the subsequent narrow QRS tracings (to exclude LBBB lasting more than 24 hours) in patients with no history of LBBB.
Old Left Bundle Branch Block
Old LBBB is defined as:[2] LBBB known to exist for more than 24 hours (by prior tracings or reports in the electronic medical record (EMR).
Left Bundle Branch Block of Unknown Duration
LBBB on tracings obtained within the first 24 hours of admission in patients with no prior ECG information.[3]
Causes of LBBB
- Chagas disease
- Coronary Artery Disease
- Dilated cardiomyopathy
- Endocarditis
- Hemochromatosis
- Hypertension
- Hypertrophic obstructive cardiomyopathy (HOCM)
- Ischemic heart disease
- Left ventricular hypertrophy
- Left ventricular outflow tract surgery
- Lyme disease [4]
- Myocardial infarction
- Myocardial ischemia
- Myocarditis
- Primary disease of the cardiac electrical conduction system
- Progressive conduction system disease
- Rheumatic fever with aortic valve involvement
- Sarcoidosis
- Scleroderma
- Septal myomectomy
EKG Diagnosis
The criteria to diagnose left bundle branch block on the electrocardiogram include the following:
- The heart rhythm must be supraventricular in origin. A wide QRS complex that is not preceded by P waves would not qualify.
- The QRS duration must be greater than or equal to 120 milliseconds
- There should be a QS or rS complex in lead V1
- There should be a monophasic R wave in leads I and V6
The T wave deflection should be the opposite the terminal deflection of the QRS complex. This lack of concordance in direction is known as appropriate T wave discordance and is expected in patients with left bundle branch block. A concordant T wave may suggest the presence of either ischemia or myocardial infarction.
- Shown below is an image of electrocardiogram in case of left bundle branch block depicting typical findings.
Reading Ischemia In The Presence Of LBBB
LBBB can simulate an MI due to the associated secondary ST changes and pseudoinfarction q waves that it is associated with, and contrariwise, it can mask the EKG changes of an MI.
Sgarbossa Criteria
An EKG scoring system was developed and the independent criterion were assessed on patients from the GUSTO-1 trial patients were scored from 0-5 for presence of LBBB in the context of acute myocardial infarction.[5]
| Criteria | Score |
| 1.ST-segment elevation ≥ 1 mm and concordant with QRS complex | 5 |
| 2.ST-segment depression ≥ 1 mm in lead V1,V2 or V3 | 3 |
| 3.ST-segment elevation ≥ 5 mm and discordant with QRS complex | 2 |
Pseudoinfarct Patterns: Simulation of an Anterior MI
- LBBB can cause poor R wave progression. In the presence of LBBB, there is often a decrease in the amplitude of R waves to the midprecordium in the absence of a septal infarct.
- QS complexes are often seen in the right precordial leads in uncomplicated LBBB and they may even extend as far out as V5 or V6.
- Non infarctional Q waves may be seen in aVL.
- The electrical basis for the apperance of q waves is that LBBB causes a loss of the normal septal R waves in the right precordial leads. The septum is no longer being depolarized from left to right as it normally does because of the delay in conduction down the left bundle. Thus, there is a loss of the early R wave.
- There can occasionally be Rs complexes in V1. These unanticipated initial positive forces are due to early RV depolarization and may actually mask the q waves (i.e. loss of initial septal forces) that accompany an anteroseptal MI.
Simulation of an Inferior MI
- Noninfarctional QS complexes can be seen in leads II, III, and aVF in LBBB.
- There are a number of autopsy cases were there are QS waves inferiorly without evidence of an MI.
- There are several reported cases of intermittent LBBB in which the QS waves inferiorly were present only in the aberrantly conducted beats.
- Conversely, LBBB may mask the development of Q waves in an MI.
Secondary ST segment and T Wave Changes
- Primary ST segment and T wave changes are repolarization changes that are seen with ischemia or electrolyte imbalance and reflect actual changes in the myocardial action potentials.
- Secondary ST segment and T wave wave changes occur when the sequence of ventricular activation is altered without any disturbance in the electrical properties of the myocardial cells such as is seen in LBBB.
- As a result of secondary ST segment and T wave wave changes, the QRS and the T wave vectors are oriented in opposite directions which is known as discordance of the QRS and T wave vectors.
- Thus, the QRS is often predominantly negative in the right precordial leads while the T wave is oriented positively. In those leads where there is a tall positive R wave there is a negative T wave.
- These secondary ST segment and T wave changes often mimic infarction, and furthermore they may mask the ST segment and T wave changes of an MI.
- Sometimes primary ST segment and T wave changes will be superimposed on the LBBB pattern and the following suggests the diagnosis of ischemia or infarction:
- ST segment elevation in leads with a predominant R wave. In uncomplicated LBBB, the ST segment is isoelectric or depressed.
- T wave inversions in the right to midprecordial leads or in other leads with a predominantly negative QRS. In other words there is an absence of discordance, and there is the presence of concordance.
- Morphology: In leads with a predominant R wave, the ST segment begins to slope downwards and blends into the T wave. The ascending limb of the T wave ascends back to the baseline at a more acute angle.
- The ischemic T waves have a more symmetric appearance and a slightly upwardly bowed ST segment.
- ST segment and T wave elevations simulating acute infarction: The ST segment can be markedly elevated (up to 10 mm or more at the J point ) in leads with a QS or rS segment in uncomplicated LBBB. In addition, there can be a loss of R wave progression.
- T wave inversions in intermittent LBBB: May develop deep T wave inversions in the right to midprecordial leads of normally conducted beats in the absence of CAD. These T wave inversions are deepest in leads V1 to V4 with a symmetric or coved appearance.
Etiology of Q Waves
- As described earlier, in LBBB there is a loss of depolarization from left to right, which produced an initial r wave in the right precordial leads.
- Now there is depolarization from right to left. Consequently the initial r wave is lost, and the non infarctional QS complexes may appear in the precordial leads.
- The reversal of septal activation results in RS complexes in the left precordial leads.
Can You Read a Left Ventricular Free Wall Infarction In the Presence of a LBBB?
- No. This pattern of infarction results in abnormal q waves in the midprecordial to lateral precordial leads.
- In LBBB the initial septal depolarization forces are directed from right to left. These leftward septal forces will produce an initial R wave in the midprecordial to the lateral precordial leads, masking the loss of potential q waves produced by the infarction.
- Therefore left ventricular free wall infarction by itself will not produce diagnostic q waves in the presence of a LBBB.
- Poor R wave progression is seen in uncomplicated LBBB.
Can You Read a Septal Infarction in the Presence of LBBB?
- Yes. Again the septal forces are directed to the left in LBBB.
- If enough of the septum is infarcted to eliminate these initial leftward septal forces, abnormal QR, QRS, or qrs types of complexes may appear in the midprecordial to lateral precordial leads.
- These initial q waves may reflect posterior and superior forces from the spared basal portion of the septum.
- Small q waves of 0.03 sec or less may be seen in leads I, V5 to V6 in uncomplicated LBBB.
- The presence of q waves laterally is an example of false localization. [6]
Physical Examination
Heart
Paradoxical split of the second heart sound
Treatment
- Medical Care: Patients with LBBB require complete cardiac evaluation, and those with LBBB and near-syncope or syncope may require a pacemaker.
- Surgical Care: Some patients with LBBB, a markedly prolonged QRS, and congestive heart failure may benefit from a pacemaker, which provides rapid left ventricular contractions.
Classification
Some sources distinguish between a "left anterior fascicular block" (LAFB)[7] and a "left posterior fascicular block" (LAPB).[8] This refers to the bifurcation of the left bundle branch.
EKG Examples
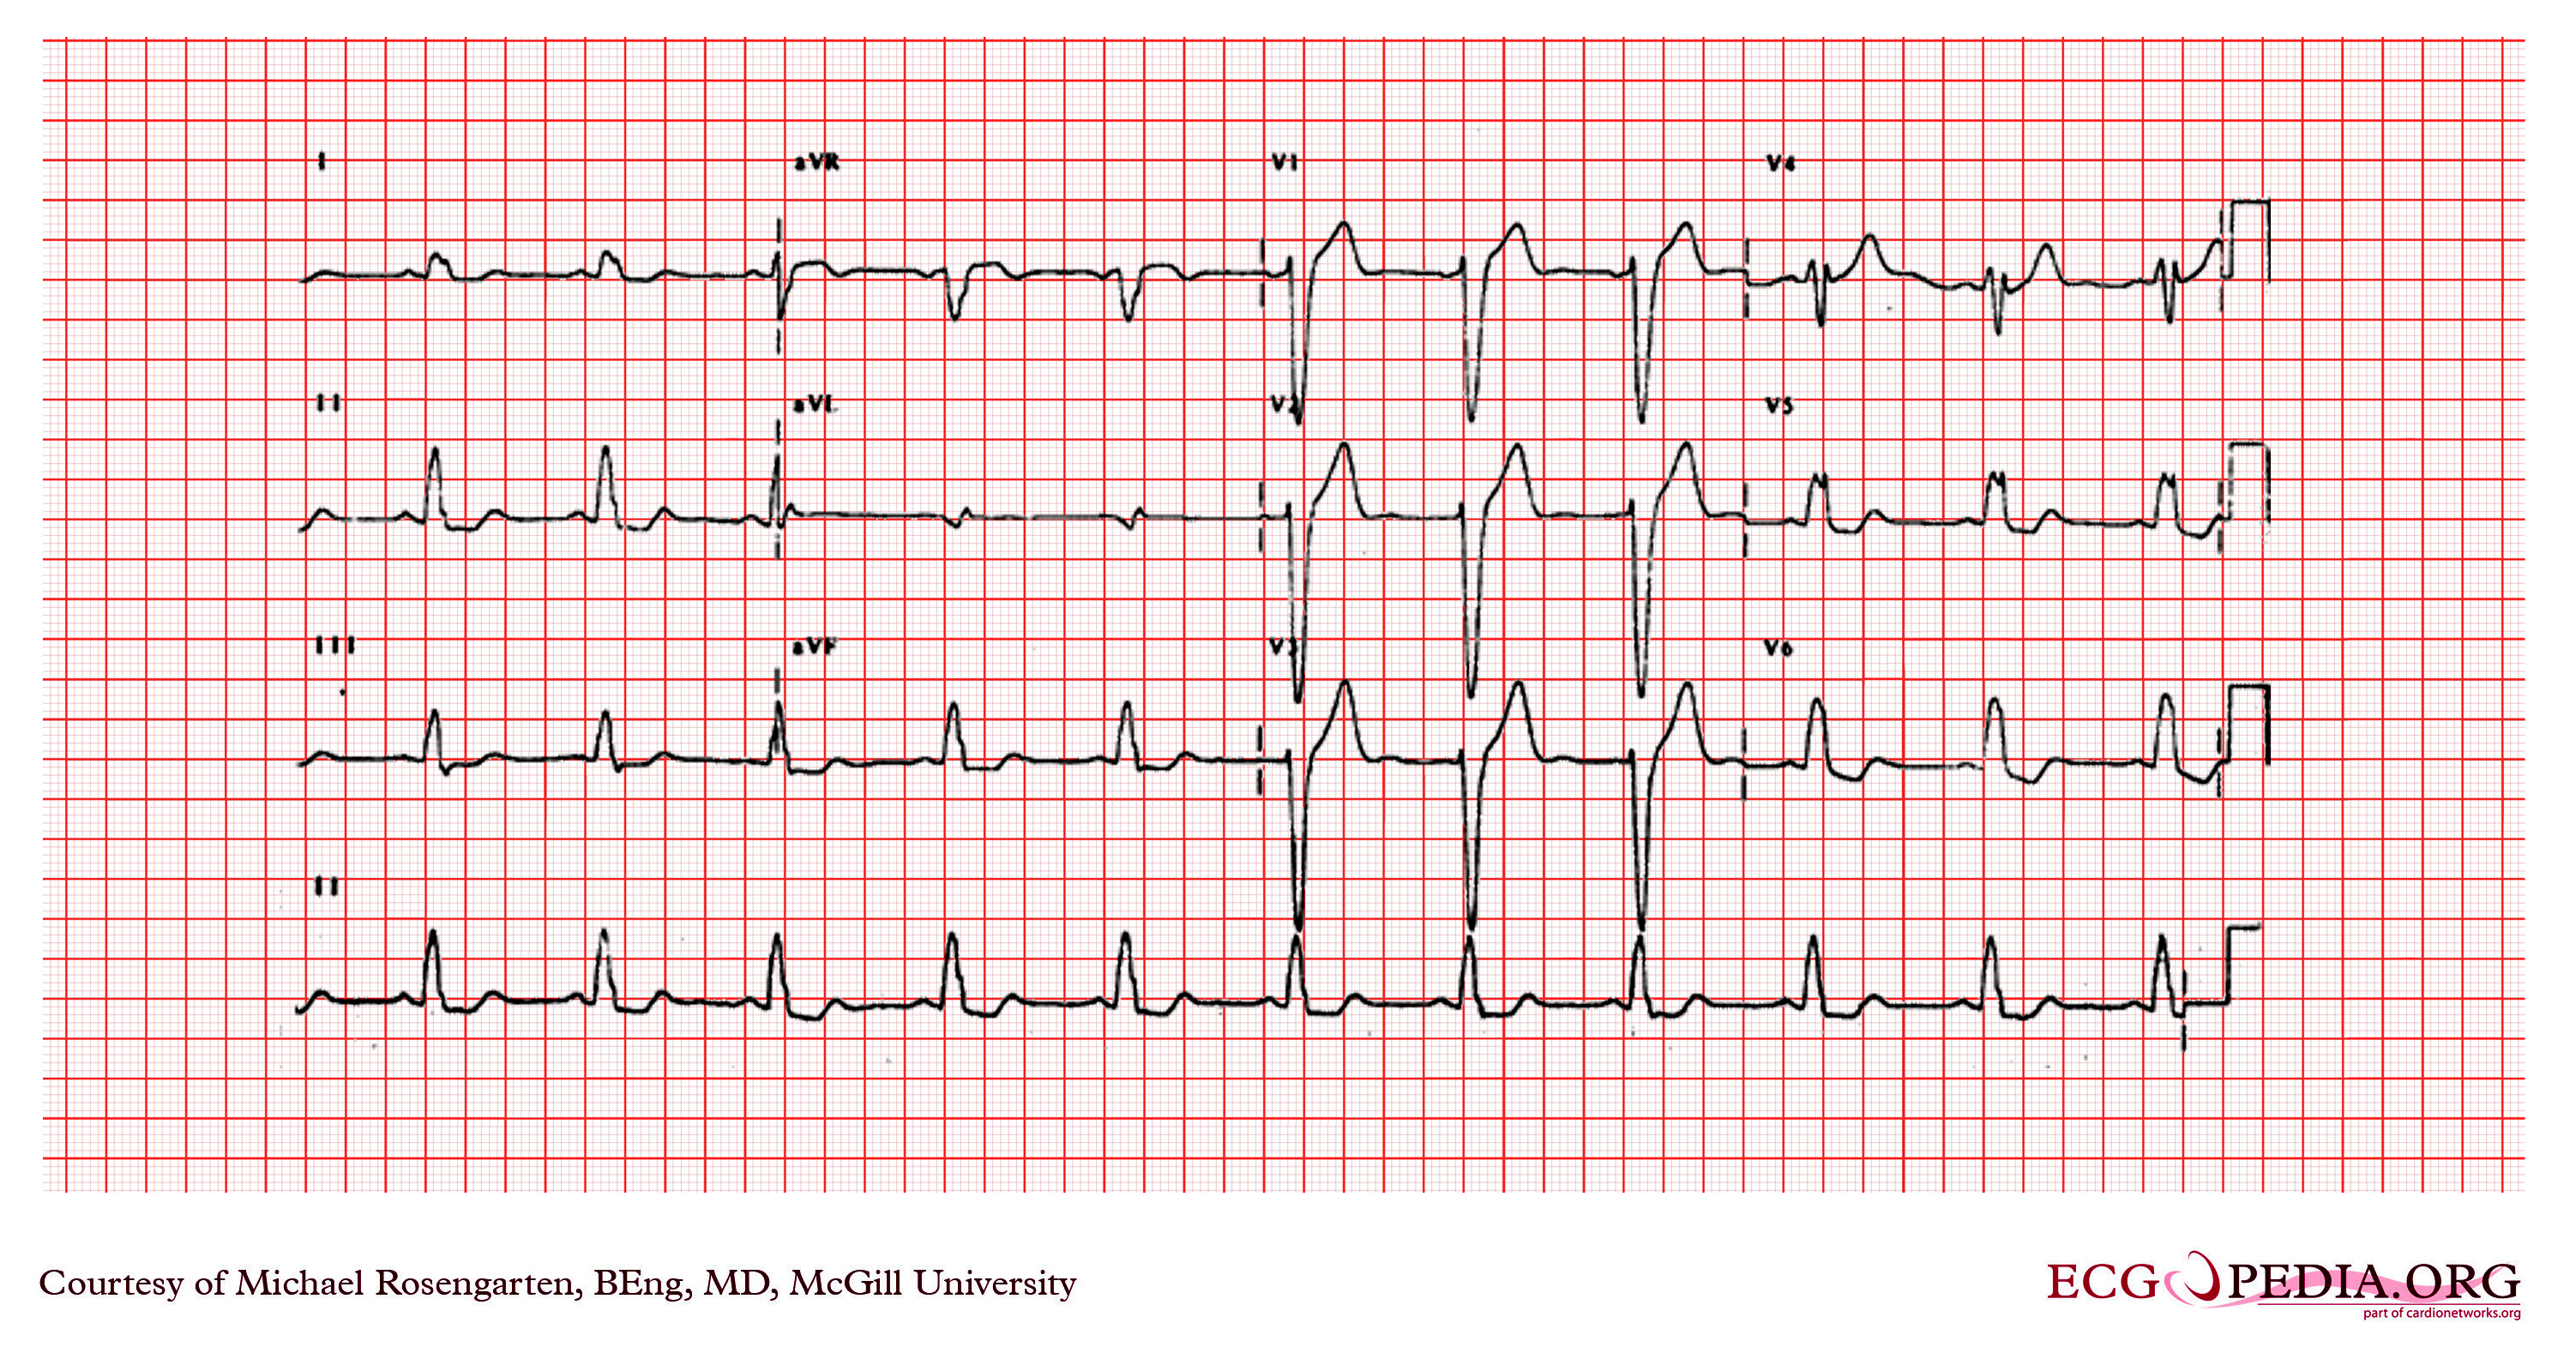
Below is an electrocardiogram showing a sinus rhythm, and the QRS is wide (>120ms.) There is a dominant R in I and V6 with the loss of septal q waves in I and the lateral precordial leads. There is a q in lead aVL but over all the recording suggests a left bundle branch block.
Below is an electrocardiogram of left bundle branch block.
Below is an electrocardiogram of left bundle branch block.
Below is an electrocardiogram of left bundle branch block.
Below is an electrocardiogram of left bundle branch block.
Below is an electrocardiogram of left bundle branch block.
Below is an electrocardiogram of left bundle branch block.
Below is an electrocardiogram of left bundle branch block.
Below is an electrocardiogram of left bundle branch block.
Below is an electrocardiogram of left bundle branch block.
Below is an electrocardiogram of left bundle branch block with left anterior fascicular block.
Below is an electrocardiogram of left bundle branch block with left anterior fascicular block and left atrial enlargement.
Below is an electrocardiogram of left bundle branch block with supraventricular tachycardia.
Below is an electrocardiogram of left bundle branch block with lateral Q waves.
Below is an electrocardiogram of left bundle branch block.
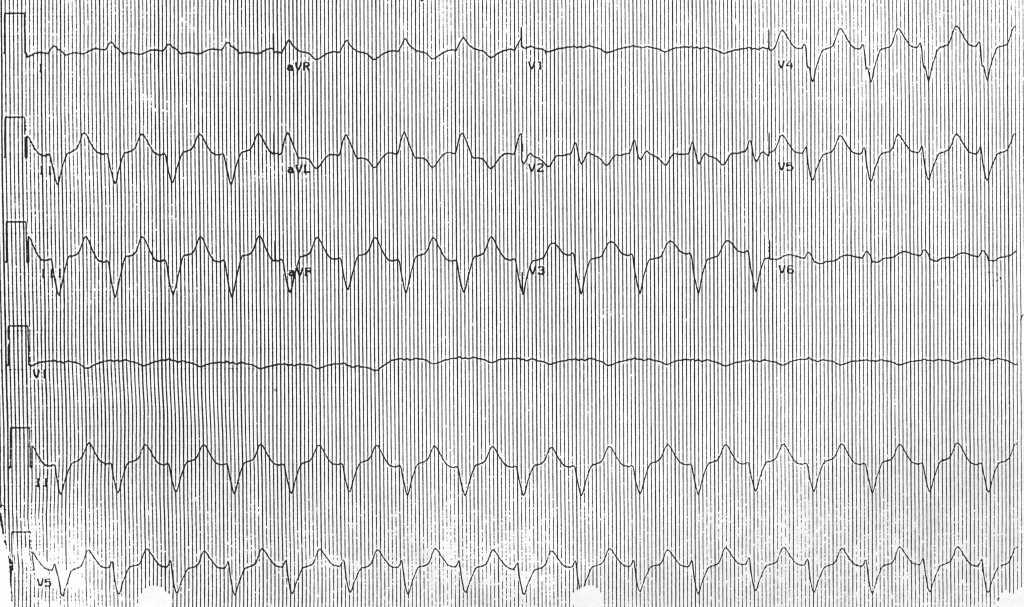
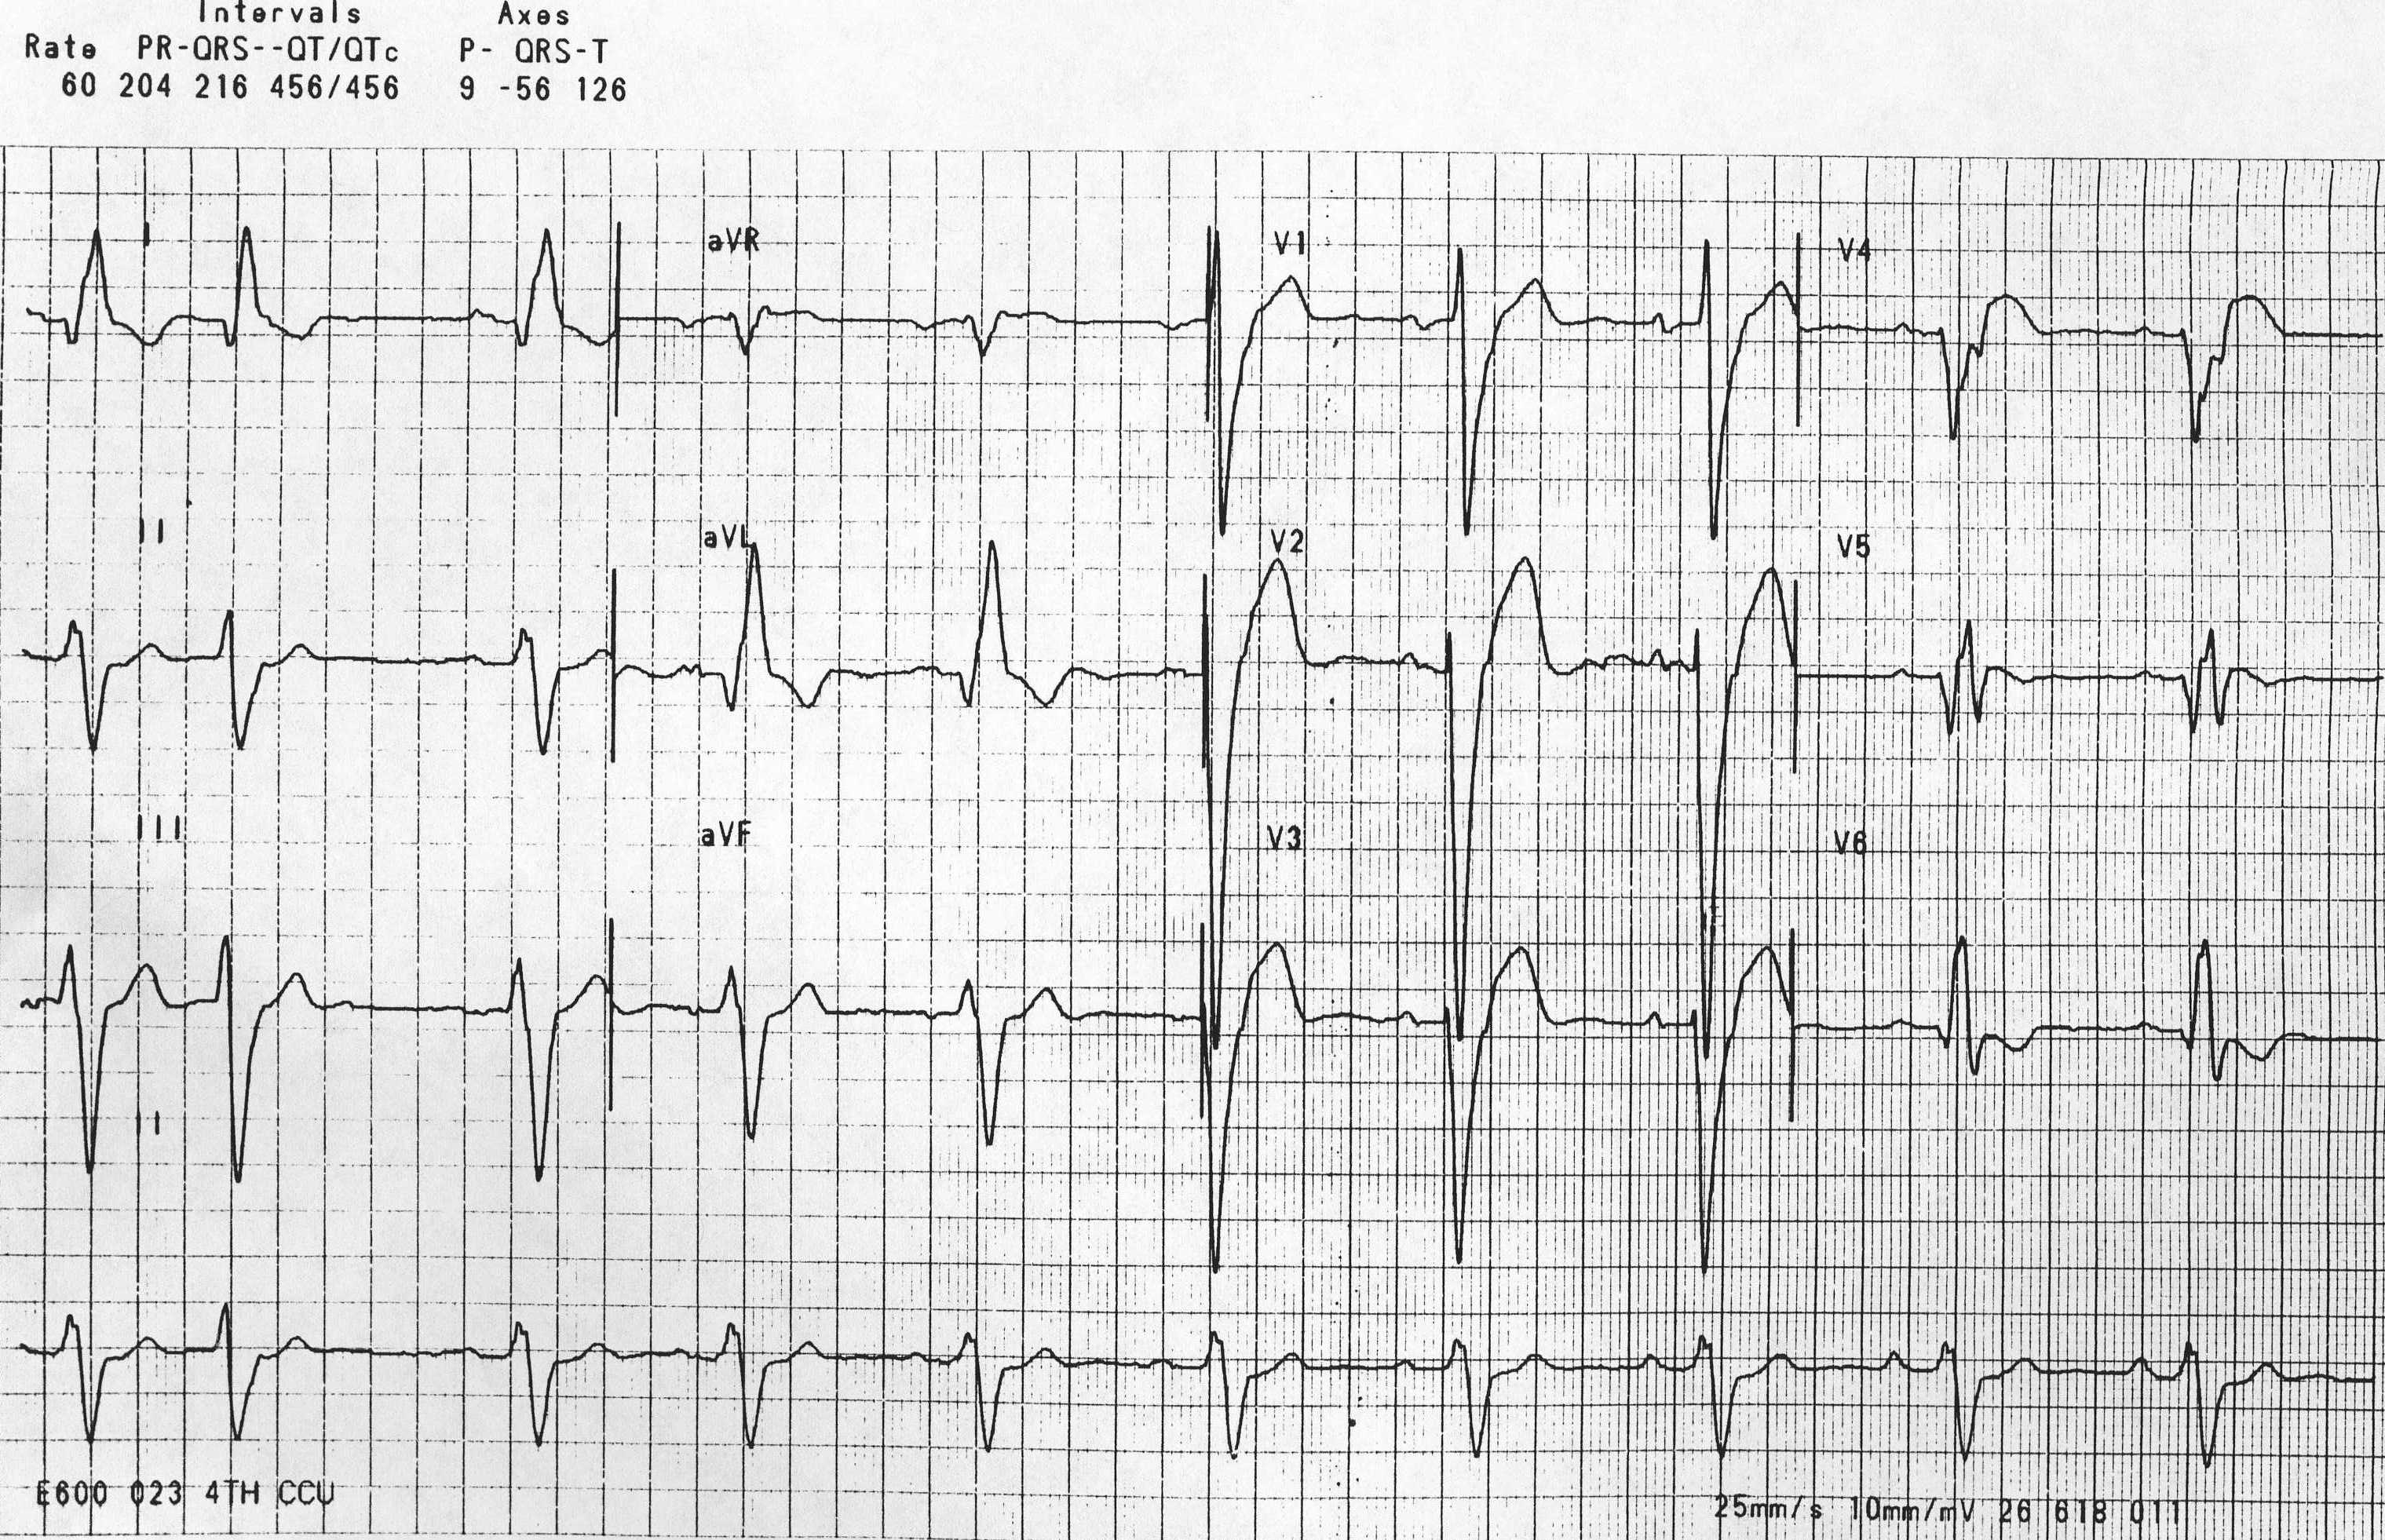
The recording below shows sinus rhythm but the PR interval is prolonged (greater than 200ms) and the QRS is wide (> 120ms). The loss of the septal Q waves and the tall broad R waves in leads I, aVL and V6 are diagnostic of a left bundle branch block.
Sources
Copyleft images obtained courtesy of ECGpedia, http://en.ecgpedia.org/index.php?title=Special:NewFiles&offset=&limit=500
See also
References
- ↑ Shvilkin A, Bojovic B, Vajdic B, Gussak I, Ho KK, Zimetbaum P, Josephson ME. Vectorcardiographic and electrocardiographic criteria to distinguish new and old left bundle branch block. Heart Rhythm 2010;7:1085–1092.
- ↑ Shvilkin A, Bojovic B, Vajdic B, Gussak I, Ho KK, Zimetbaum P, Josephson ME. Vectorcardiographic and electrocardiographic criteria to distinguish new and old left bundle branch block. Heart Rhythm 2010;7:1085–1092.
- ↑ Shvilkin A, Bojovic B, Vajdic B, Gussak I, Ho KK, Zimetbaum P, Josephson ME. Vectorcardiographic and electrocardiographic criteria to distinguish new and old left bundle branch block. Heart Rhythm 2010;7:1085–1092.
- ↑ http://onlinelibrary.wiley.com/doi/10.1111/j.1540-8159.1990.tb04009.x/abstract
- ↑ Sgarbossa EB, Pinski SL, Barbagelata A, Underwood DA, Gates KB, Topol EJ, Califf RM, Wagner GS (1996). "Electrocardiographic diagnosis of evolving acute myocardial infarction in the presence of left bundle-branch block. GUSTO-1 (Global Utilization of Streptokinase and Tissue Plasminogen Activator for Occluded Coronary Arteries) Investigators". N. Engl. J. Med. 334 (8): 481–7. PMID 8559200. Unknown parameter
|month=ignored (help) - ↑ Myocardial Infarction, Electrocardiographic Differential Dx, Ary L. Goldberger, 3rd ed., Mosby Co., St. Louis, 1984, p.85 93.
- ↑ Template:GPnotebook
- ↑ Template:GPnotebook
External links
Additional resources
- The whole ECG - A basic ECG primer
- 12-lead ECG library
- Simulation tool to demonstrate and study the relation between the electric activity of the heart and the ECG
- ECG information from Children's Hospital Heart Center, Seattle
- ECG Challenge from the ACC D2B Initiative
- National Heart, Lung, and Blood Institute, Diseases and Conditions Index
- A history of electrocardiography
- EKG Interpretations in infants and children
