Ischemic stroke pathophysiology
|
Ischemic Stroke Microchapters |
|
Diagnosis |
|---|
|
Treatment |
|
Case Studies |
|
Ischemic stroke pathophysiology On the Web |
|
American Roentgen Ray Society Images of Ischemic stroke pathophysiology |
|
Risk calculators and risk factors for Ischemic stroke pathophysiology |
Editor-In-Chief: C. Michael Gibson, M.S., M.D. [1]Associate Editor(s)-in-Chief: Aysha Anwar, M.B.B.S[2]
Overview
Pathophysiology
The pathophysiology of ischemic stroke may depend on the underlying cause of ischemia. Ischemic infarct may be categorised into two types depending on the area of the brain involved:
| Type of ischemia | Pathogenesis | |||
|---|---|---|---|---|
| Underlying cause | Part of the brain involved | Time of initiation of cell death | Type of cell death | |
| Focal |
Thrombosis |
Focal area supplied by the occluded vessel |
Acute onset (3-4 hrs) |
Necrosis-central area |
| Global |
Systemic hypoperfusion |
Water shed area |
Delayed onset (12 hrs) |
Apoptosis |
Hemodynamic changes in ischemic stroke
- Hemodynamic changes in ischemic stroke results from cerebral autoregulation dysfunction as brain tissue is highly sensitive to mild changes in oxygen levels
- Several minutes of hypoxia leads to irreversible injury
- Cerebral autoregulation maintains the perfusion pressure in the brain between the pressure range of 60-150 mmHg via vasoconstriction and vasodilation.
- Pressure changes below 60 mmHg and more than 150 mm Hg disrupts the normal autoregulation.
- Below 60 mm Hg, initially there is extensive vasodilation of the affected vessels to increase blood flow to the affected area which may later result in inhibition of protein synthesis and increase in anaerobic glycolysis if blood flow rate drops down below 30ml/100g.
- Blood flow rates below 20ml/100gm results in extensive membrane damage causing cell death.
Molecular pathophysiology of ischemic stroke
The sequence of molecular changes that may result due to ischemia include:
- Prolonged ischemia- decrease in oxygen delivery to the cells
- Anaerobic glycolysis with decline in ATP production
- Increased lactic acid production
- Increased free oxygen and nitrate radicals-cell membrane and DNA damage
- Excitatory neurotransmittor -glutamate is increased in neuronal synapses leading to NMDA receptor activation
- NMDA receptor activation causes opening of ion channels in the cell membrane causing K+ efflux and Na+, Ca2+ and water influx
- Increased Ca2+ influx activates apoptotic cell death pathways
- ATP required for final steps of apoptosis, hence massive decline in ATP results in necrosis of cells
Cellular changes in Ischemic stroke
Disruption of blood brain barrier
- Release of proteases (matrix metalloproteinases, MMP) due to cell membrane damage-ATP depletion + free radicals
- MMP causes degradation of collagens and laminins in the basement membrane of the cells and blood vessels
- Disruption of blood brain barrier may lead to hemorrhage
- Cerebral edema due to increased Na, Ca and water influx into the cells.
Genetics
The following gene loci may increase the risk for stroke:
- PITX2 and ZFHX3- atrial fibrillation and cardioembolic stroke
- HDAC9-large vessel disease
- ABO-ischemic stroke
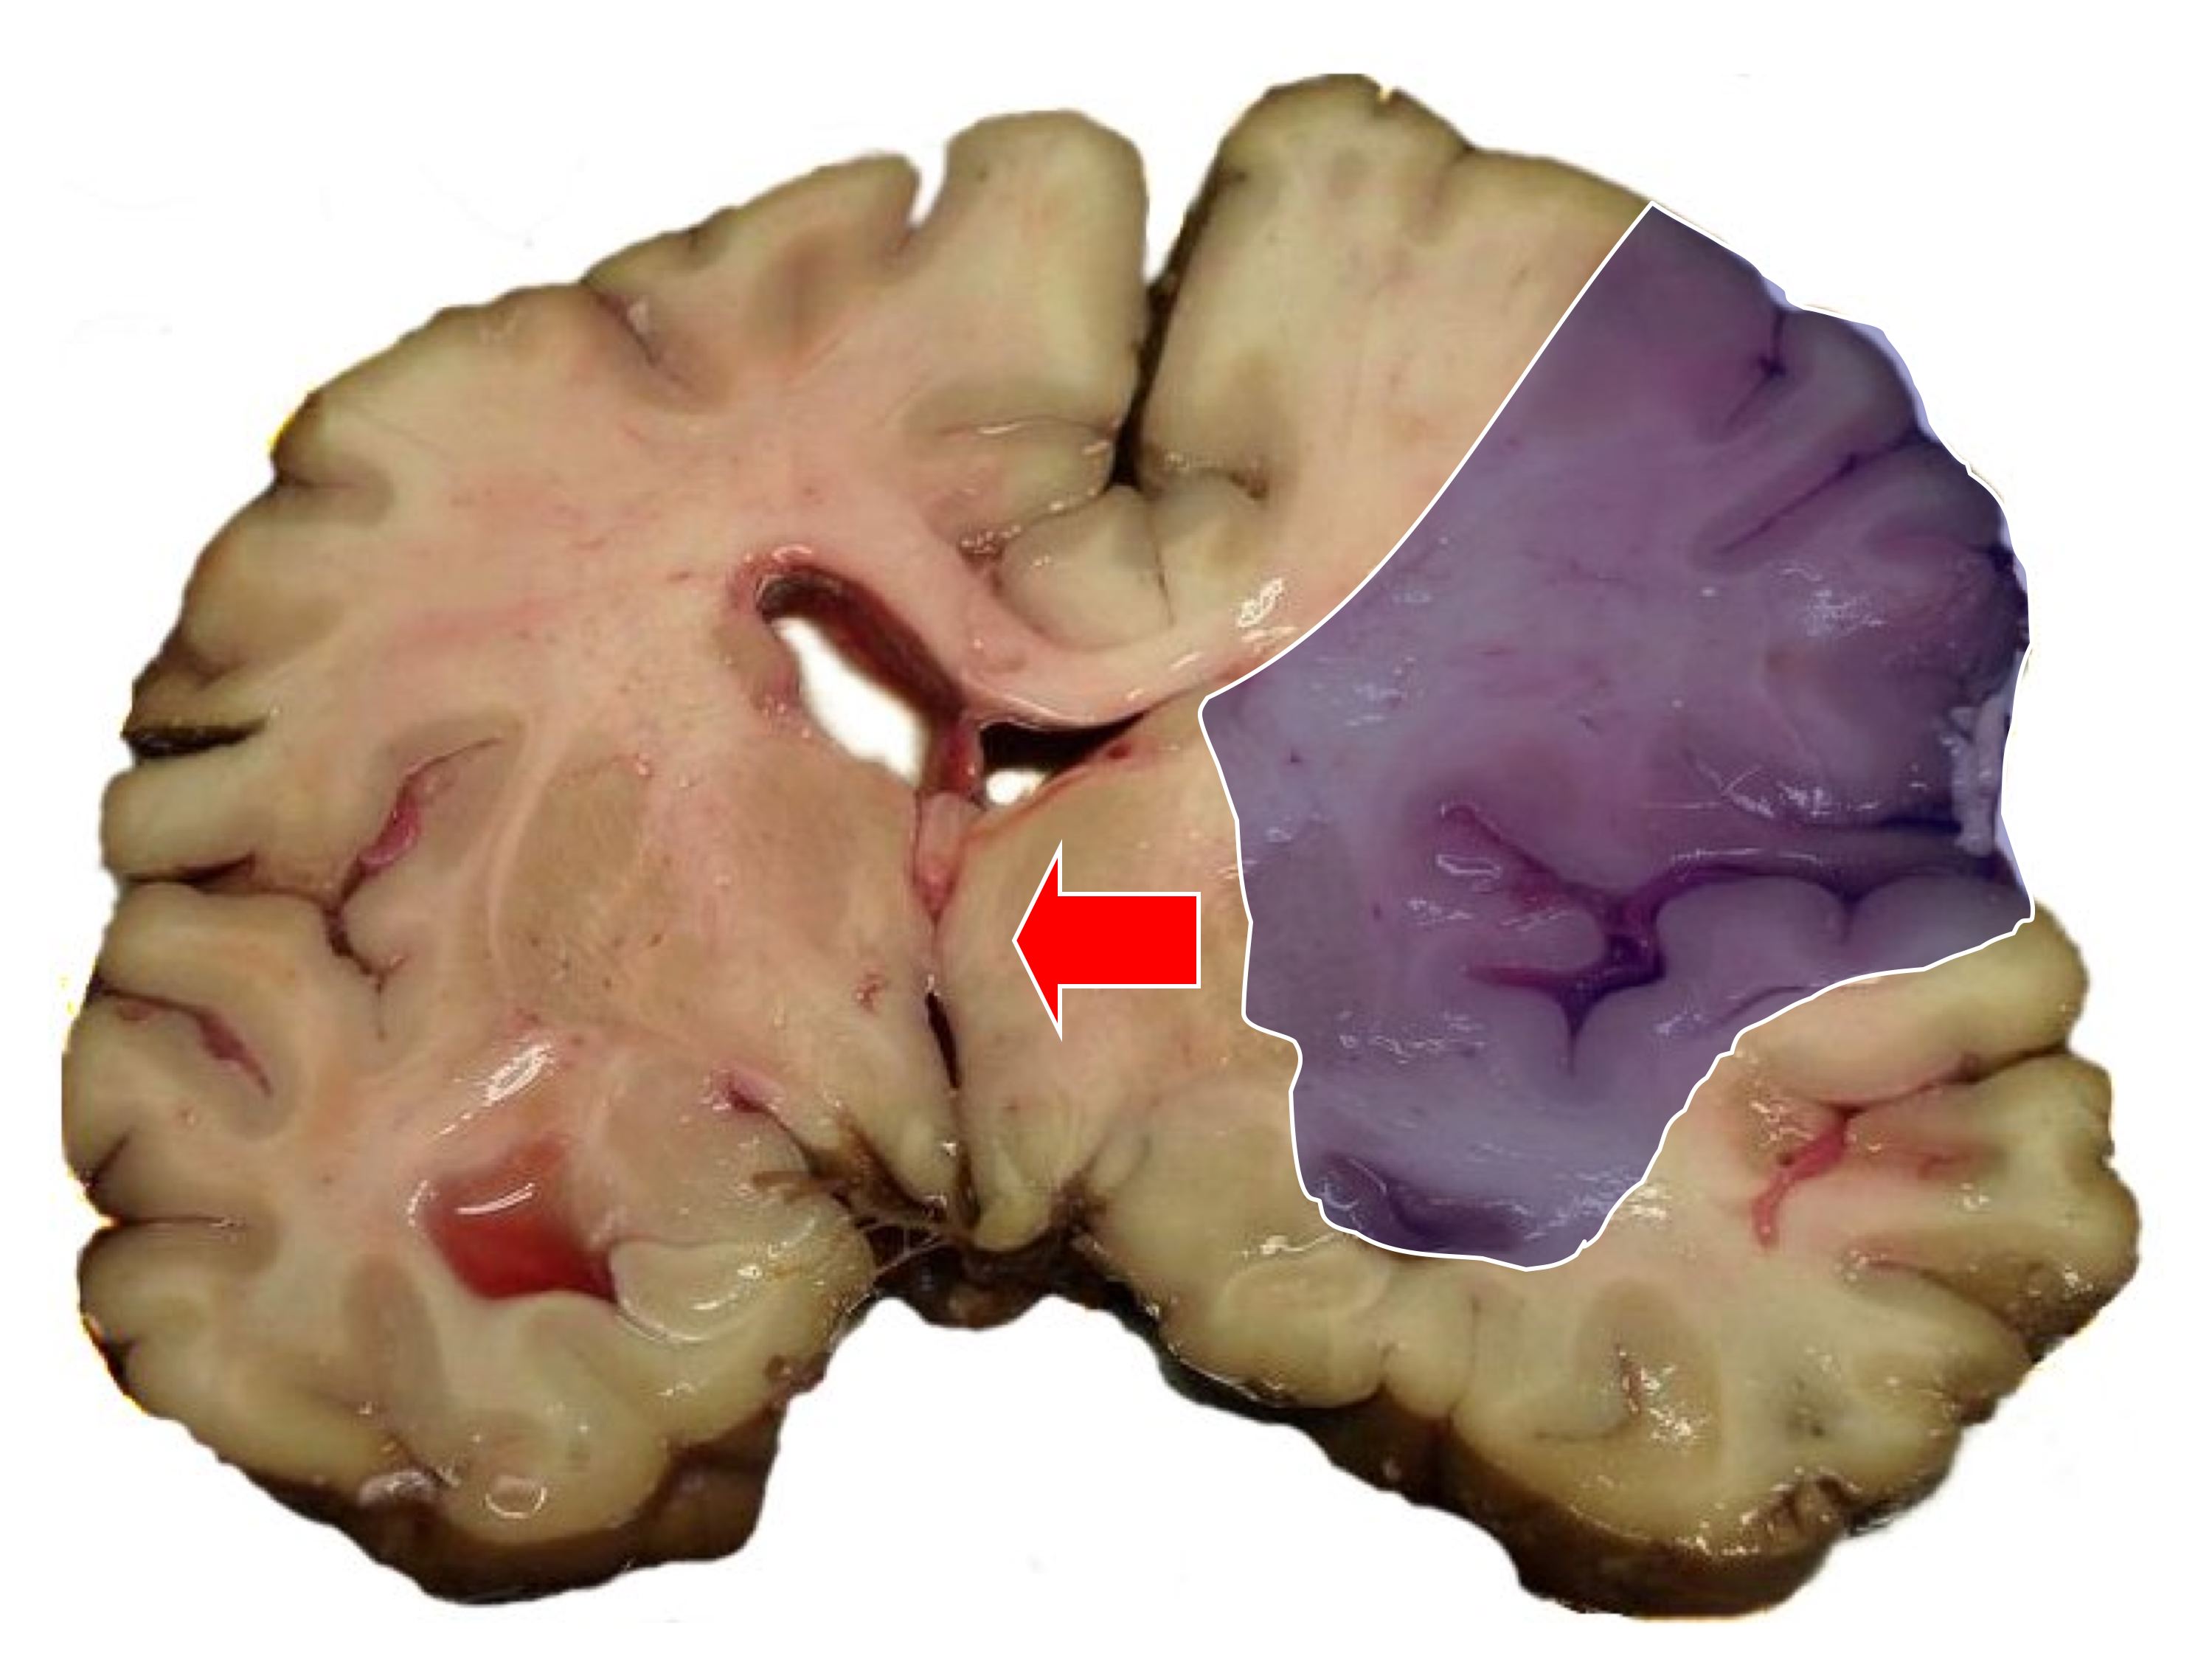
Gross pathology
On gross pathology,
- Central necrotic tissue is called umbra
- Peripheral tissue which surrounds area of necrosis and can be salvaged with increased blood flow is called pneumbra
Microscopic pathology
- Within 1-6 min of ischemia, red neurons and vacoulation results
- If ischemia lasts > 6 min, karryorhexis and cell death occurs
Gross and microscopic changes that may occur due to ischemia with the passage of time is tabulated below:
| Duration | Gross pathology | Microscopic pathology |
|---|---|---|
| Immediate
<24 hrs |
No change | Cellular edema |
| Acute
<1 week |
Edema
Loss of grey and white matter junction |
Red neurons
Necrosis Neutrophilia |
| Subacute
1-4 weeks |
Soft friable tissue
Cyst formation |
Macrophages
Liquifactive necrosis |
| Chronic
>4 weeks |
Fibrosis
Fluid filled cysts with dark grey margin |
Gliosis
Necrotic tissue cleared by macrophages |
 |
 |
References
- ↑ Caplan LR (1992). "Intracerebral hemorrhage". Lancet. 339 (8794): 656–8. PMID 1347346.