Synchrotron radiation astronomy
Editor-In-Chief: Henry A. Hoff
Synchrotron radiation is radiation produced from particles traveling along curved paths near the speed of light.
Radiation
"Synchrotron radiation is the electromagnetic radiation emitted when charged particles travel in curved paths. Because in most accelerators the particle trajectories are bent by magnetic fields, synchrotron radiation is also called Magneto-Bremsstrahlung. The emitted spectrum is broadband from the microwave (harmonics of the driving RF field) to x-ray spectral regions. The radiation is vertically collimated and polarized. The synchrotron radiation output can be calculated if the electron energy, bending radius, electron current, angle relative to the orbital plane, the distance to the tangent point and vertical and horizontal acceptance angles are known."[1]
Cyclotron radiation
Forms of decametric radio signals from Jupiter:
- bursts (with a wavelength of tens of meters) vary with the rotation of Jupiter, and are influenced by interaction of Io with Jupiter's magnetic field.[2]
- emission (with wavelengths measured in centimeters) was first observed by Frank Drake and Hein Hvatum in 1959.[3] The origin of this signal was from a torus-shaped belt around Jupiter's equator. This signal is caused by cyclotron radiation from electrons that are accelerated in Jupiter's magnetic field.[4]
Theoretical synchrotron radiation
Def. "the electromagnetic radiation emitted by the accelerating charged particles in a synchrotron that are moving at near the speed of light""the electromagnetic radiation emitted by the accelerating charged particles in a synchrotron that are moving at near the speed of light"[5] is called synchrotron radiation.
"We now assume that the γ-rays are produced [from 3C 279] by relativistic electrons via Compton scattering of synchrotron photons (SSC). In any such model, the fact that the γ-rays luminosity, produced via Compton scattering, is higher than that emitted at lower frequencies (1014 - 1016 Hz), supposedly via the synchrotron process, implies a radiation energy density, Ur, higher than the magnetic energy density, UB. From the observed power ratio we derive that Ur must be one order of magnitude greater than UB, which may be a lower limit if Klein-Nishina effects reduce the efficiency of the self-Compton emission. This result is independent of the degree of beaming, which, for a homogeneous source, affects both the synchrotron and the self-Compton fluxes in the same way. This source is therefore the first observed case of the result of a Compton catastrophe (Hoyle, Burbidge, & Sargent 1966)."[6]
Sources
Astrophysical X-ray sources are astronomical objects with physical properties which result in the emission of X-rays.
There are a number of types of astrophysical objects which emit X-rays, from galaxy clusters, through black holes in active galactic nuclei (AGN) to galactic objects such as supernova remnants, stars, and binary stars containing a white dwarf (cataclysmic variable stars and super soft X-ray sources), neutron star or black hole (X-ray binaries). Some solar system bodies emit X-rays, the most notable being the Moon, although most of the X-ray brightness of the Moon arises from reflected solar X-rays. A combination of many unresolved X-ray sources is thought to produce the observed X-ray background. The X-ray continuum can arise from bremsstrahlung, either magnetic or ordinary Coulomb, black-body radiation, synchrotron radiation, inverse Compton scattering of lower-energy photons be relativistic electrons, knock-on collisions of fast protons with atomic electrons, and atomic recombination, with or without additional electron transitions.[7]
The origin of all observed astronomical X-ray sources is in, near to, or associated with a coronal cloud or gas at coronal cloud temperatures for however long or brief a period.
For some plasma sources, "an exponential spectrum corresponding to a thermal bremsstrahlung source [may fit]":
N(E)dE = E0-1 * exp-E/kTdE.
dN/dE = (E0/E) * exp-E/kT, where a least squares fit to the radiated detection data yields a kT.[8]
Another equation used to study astronomical events is the power law:
- <math>f(x) = ax^k</math>.
In terms of radiation detected, for example, f(x) = photons (cm2-sec-keV)-1 versus keV. As the photon flux decreases with increasing keV, the exponent (k) is negative. Observations of X-rays have sometimes found the spectrum to have an upper portion with k ~ -2.3 and the lower portion being steeper with k ~ -4.7.[9] This suggests a two stage acceleration process.[9]
The synchrotron functions are defined as follows (for x ≥ 0):
- First synchrotron function
- <math>F(x) = x \int_x^\infty K_{\frac{5}{3}}(t)\,dt</math>
- Second synchrotron function
- <math>G(x) = x K_{\frac{2}{3}}(x)</math>
where Kj is the modified Bessel function of the second kind. The function F(x) is shown on the right, as the output from a plot in Mathematica.
In astrophysics, x is usually a ratio of frequencies, that is, the frequency over a critical frequency (critical frequency is the frequency at which most synchrotron radiation is radiated). This is needed when calculating the spectra for different types of synchrotron emission. It takes a spectrum of electrons (or any charged particle) generated by a separate process (such as a power law distribution of electrons and positrons from a constant injection spectrum) and converts this to the spectrum of photons generated by the input electrons/positrons.
Electromagnetics
"The magnetic field is well-ordered in many jets, as shown by polarization measurements. Synchrotron radiation can be very highly polarized (50%) if the field is globally ordered, and some sources [approach] this level. The electric vectors show clear structure and alignment; an especially common pattern is for the field lines to be along the jet in the inner portions and transition to an azimuthal configuration farther out. This is seen in [PKS0521-36 at 2 cm]."[10]
Continua
Like X-rays, the gamma-ray continuum can arise from bremsstrahlung, black-body radiation, synchrotron radiation, or what is called inverse Compton scattering of lower-energy photons by relativistic electrons, knock-on collisions of fast protons with atomic electrons, and atomic recombination, with or without additional electron transitions.[7]
The radio continuum from an active galactic nucleus is always due to a jet. It shows a spectrum characteristic of synchrotron radiation.
"[T]he diffuse blue region is predominantly produced by synchrotron radiation, which is radiation given off by the curving motion of electrons in a magnetic field. The radiation corresponded to electrons moving at speeds up to half the speed of light."[11]
A synchrotron model for the continuum spectrum of the Crab Nebula fits the radiation given off.[12]
In the Crab Nebula X-ray spectrum there are three features that differ greatly from Scorpius X-1: its spectrum is much harder, its source diameter is in light-years (ly)s, not astronomical units (AU), and its radio and optical synchrotron emission are strong.[7] Its overall X-ray luminosity rivals the optical emission and could be that of a nonthermal plasma. However, the Crab Nebula appears as an X-ray source that is a central freely expanding ball of dilute plasma, where the energy content is 100 times the total energy content of the large visible and radio portion, obtained from the unknown source.[7]
Emissions
Alpha decay is characterized by the emission of an alpha particle, a 4He nucleus. The mode of this decay causes the parent nucleus to decrease by two protons and two neutrons. This type of decay follows the relation:
<math>{}_Z^A\!X\to {}_{Z-2}^{A-4}\!Y+ {}_4^2\alpha</math> [13]
Neutron activation is the process in which neutron radiation induces radioactivity in materials, and occurs when atomic nuclei capture free neutrons, becoming heavier and entering excited states. The excited nucleus often decays immediately by emitting particles such as neutrons, protons, or alpha particles. The neutron capture, even after any intermediate decay, often results in the formation of an unstable activation product. Such radioactive nuclei can exhibit half-lives ranging from small fractions of a second to many years.
Proton emission (also known as proton radioactivity) is a type of radioactive decay in which a proton is ejected from a nucleus. Proton emission can occur from high-lying excited states in a nucleus following a beta decay, in which case the process is known as beta-delayed proton emission, or can occur from the ground state (or a low-lying [nuclear isomer] isomer) of very proton-rich nuclei, in which case the process is very similar to alpha decay.
Beta decay is characterized by the emission of a neutrino and a negatron which is equivalent to an electron. This process occurs when a nucleus has an excess of neutrons with respect to protons, as compared to the stable isobar. This type of transition converts a neutron into a proton; similarly, a positron is released when a proton is converted into a neutron. These decays follows the relation:
<math>{}_Z^A\!X\to {}_{Z+1}^A\!Y+ \bar{\nu} + \beta^-</math>
<math>{}_Z^A\!X\to {}_{Z-1}^A\!Y+ \nu + \beta^+</math> [14]
Gamma ray emission is follows the previously discussed modes of decay when the decay leaves a daughter nucleus in an excited state. This nucleus is capable of further de-excitation to a lower energy state by the release of a photon. This decay follows the relation:
<math>{}^A\!X^* \to {}^A\!Y + \gamma </math>[15]
Generation of electromagnetic radiation can occur whenever charged particles pass within certain distances of each other without being in fixed orbits, the accelerations (or decelerations) may give off the radiation. This is partly illustrated by the diagram at right where an electron has its course altered by near passage by a positive particle. Bremsstrahlung radiation also occurs when two electrons or other similarly charged particles pass close enough to deflect, slow down, or speed up at least one of the particles.
Bremsstrahlung includes synchrotron and cyclotron radiation.
When high-energy radiation bombards materials, the excited atoms within emit characteristic "secondary" (or fluorescent) radiation.
Accelerator physics
Accelerator physics consists of two basic parts: particle acceleration and beam dynamics.[16] "Accelerator physics relates primarily to the interaction of charged particles with electromagnetic fields."[16]
Def. "[t]he interplay between particles and fields is called beam dynamics."[16] Boldening is added.
"α particles escaping the Coulomb barrier of Ra and Th nuclei" is a natural radioactive accelerator.[17] "Cosmic rays arise from galactic source accelerators."[17]
A cyclotron is a compact type of particle accelerator in which charged particles in a static magnetic field are travelling outwards from the center along a spiral path and get accelerated by radio frequency electromagnetic fields. ... Cyclotrons accelerate charged particle beams using a high frequency alternating voltage which is applied between two "D"-shaped electrodes (also called "dees"). An additional static magnetic field <math>B</math> is applied in perpendicular direction to the electrode plane, enabling particles to re-encounter the accelerating voltage many times at the same phase. To achieve this, the voltage frequency must match the particle's cyclotron resonance frequency
- <math>f = \frac{q B}{2\pi m}</math>,
with the relativistic mass m and its charge q. This frequency is given by equality of centripetal force and magnetic Lorentz force. The particles, injected near the center of the magnetic field, increase their kinetic energy only when recirculating through the gap between the electrodes; thus they travel outwards along a spiral path.
Cyclotron radiation is electromagnetic radiation emitted by moving charged particles deflected by a magnetic field. The Lorentz force on the particles acts perpendicular to both the magnetic field lines and the particles' motion through them, creating an acceleration of charged particles that causes them to emit radiation (and to spiral around the magnetic field lines). Cyclotron radiation is emitted by all charged particles travelling through magnetic fields, however, not just those in cyclotrons. Cyclotron radiation from plasma in the interstellar medium or around black holes and other astronomical phenomena is an important source of information about distant magnetic fields. The power (energy per unit time) of the emission of each electron can be calculated using:
<math>{-dE \over dt}={\sigma_t B^2 V^2 \over c \mu_o} </math>
where E is energy, t is time, <math> \sigma_t </math> is the Thomson cross section (total, not differential), B is the magnetic field strength, V is the velocity perpendicular to the magnetic field, c is the speed of light and <math> \mu_o </math> is the permeability of free space.
A synchrotron is a particular type of cyclic particle accelerator originating from the cyclotron in which the guiding magnetic field (bending the particles into a closed path) is time-dependent, being synchronized to a particle beam of increasing kinetic energy. The synchrotron is one of the first accelerator concepts that enable the construction of large-scale facilities, since bending, beam focusing and acceleration can be separated into different components. Unlike in a cyclotron, synchrotrons are unable to accelerate particles from zero kinetic energy; one of the obvious reasons for this is that its closed particle path would be cut by a device that emits particles. Thus, schemes were developed to inject pre-accelerated particle beams into a synchrotron. The pre-acceleration can be realized by a chain of other accelerator structures like a linac, a microtron or another synchrotron; all of these in turn need to be fed by a particle source comprising a simple high voltage power supply, typically a Cockcroft-Walton generator.
Protons
"Radio observations at 210 GHz taken by the Bernese Multibeam Radiometer for KOSMA (BEMRAK) [...] at submillimeter wavelengths [show an impulsive component that] starts simultaneously with high-energy (>200 MeV nucleon−1) proton acceleration and the production of pions. The derived radio source size is compact (≤10"), and the emission is cospatial with the location of precipitating flare-accelerated >30 MeV protons as seen in γ-ray imaging."[18]
In the Large Hadron Collider (LHC) proton bunches also produce synchrotron radiation at increasing amplitude and frequency as they accelerate with respect to the vacuum field, propagating photoelectrons, which in turn propagate secondary electrons from the pipe walls with increasing frequency and density up to 7x10¹⁰. Each proton may lose 6.7keV per turn due to this phenomenon.[19]
Electrons
"Radio observations at 210 GHz taken by the Bernese Multibeam Radiometer for KOSMA (BEMRAK) [of] high-energy particle acceleration during the energetic solar flare of 2003 October 28 [...] at submillimeter wavelengths [reveal] a gradual, long-lasting (>30 minutes) component with large apparent source sizes (~60"). Its spectrum below ~200 GHz is consistent with synchrotron emission from flare-accelerated electrons producing hard X-ray and γ-ray bremsstrahlung assuming a magnetic field strength of ≥200 G in the radio source and a confinement time of the radio-emitting electrons in the source of less than 30 s. [... There is a] close correlation in time and space of radio emission with the production of pions".[18]
Gamma rays
A "fading counterpart to GRB 980329 at 850 μm [has been found]. [...] the sub-millimeter flux was relatively bright. [...] The radio through sub-millimeter spectrum of GRB 980329 is well fit by a power law with index α = +0.9. However, we cannot exclude a ν1/3 power law attenuated by synchrotron self-absorption."[20]
X-rays
NGC 383 is a double radio galaxy[3] with a quasar-like appearance located in the constellation Pisces. [...] Recent discoveries by the National Radio Astronomy Observatory in 2006 reveal that NGC 383 is being bisected by high energy relativistic electrons traveling at relatively high fractions of the speed of light. These relativistic electrons are detected as synchrotron radiation in the x-ray and radio wavelengths. The focus of this intense energy is the galactic center of NGC 383. The relativistic electron jets detected as synchrotron radiation extend for several thousand parsecs and then appear to dissipate at the ends in the form of streamers or filaments.
"Inside [the] X-ray error box [for GRB 980329], a variable radio source VLA J070238.0+385044 was found that was similar to GRB 970508 (Taylor et al. 1998a, 1998b)."[20]
Blues
The image at right shows the blue light, towards the lower right, due to synchrotron radiation, of a jet emerging from the bright active galactic nucleus (AGN) core of Messier 87.
The image above shows a blue glow in the surrounding air from emitted cyclotron particulate radiation.
At left is an image that shows the blue glow resulting from a beam of relativistic electrons as they slow down. This deceleration produces synchrotron light out of the beam line of the National Synchrotron Light Source.
Submillimeters
Submillimeter observations
- determine "the breaks in the radio to sub-millimeter to optical spectrum so that the spectral shape can be compared to the synchrotron models"[20]
- determine "the evolution of the sub-millimeter flux"[20] and
- look "for underlying quiescent sources that may be dusty star-forming galaxies at high redshifts."[20]
Radios
“Although some radio waves are produced by astronomical objects in the form of thermal emission, most of the radio emission that is observed from Earth is seen in the form of synchrotron radiation, which is produced when electrons oscillate around magnetic fields.[21]
"Radio galaxies and their relatives, radio-loud quasars and blazars, are types of active galaxy which are very luminous at radio wavelengths (up to 1038 W between 10 MHz and 100 GHz). The radio emission is due to the synchrotron process. The observed structure in radio emission is determined by the interaction between twin jets and the external medium, modified by the effects of relativistic beaming. Radio-loud active galaxies are interesting not only in themselves, but also because they can be detected at large distances, making them valuable tools for observational cosmology. Recently, a good deal of work has been done on the effects of these objects on the intergalactic medium, particularly in galaxy groups and clusters."[22]
"The radio emission from radio-loud active galaxies is synchrotron emission, as inferred from its very smooth, broad-band nature and strong polarization. This implies that the radio-emitting plasma contains, at least, electrons and magnetic fields. Since the plasma must be neutral, it must also contain either protons or positrons. There is no way of determining the particle content directly from observations of synchrotron radiation. Moreover, there is no way of determining the energy densities in particles and magnetic fields from observation (that is, the same synchrotron emissivity may be a result of a few electrons and a strong field, or a weak field and many electrons, or something in between). It is possible to determine a minimum energy condition which is the minimum energy density that a region with a given emissivity can have (Burbidge 1956), but for many years there was no particular reason to believe that the true energies were anywhere near the minimum energies."[22]
"A sister process to synchrotron radiation is the inverse-Compton process, in which the relativistic electrons interact with ambient photons and Thomson scatter them to high energies. Inverse-Compton emission from radio-loud sources turns out to be particularly important in X-rays (e.g. Croston et al. 2005) and, because it depends only on the density of electrons (and on the density of photons, which is known), a detection of inverse-Compton scattering allows a (somewhat model-dependent) estimate of the energy densities in the particles and magnetic fields. This has been used to argue that most sources are actually quite near the minimum-energy condition."[22]
"Synchrotron radiation is not confined to radio wavelengths: if the radio source can accelerate particles to high enough energies, features which are detected in the radio may also be seen in the infrared, optical, ultraviolet or even X-ray, though in the latter case the electrons responsible must have energies in excess of 1 TeV in typical magnetic field strengths. Again, polarization and continuum spectrum are used to distinguish synchrotron radiation from other emission processes. Jets and hotspots are the usual sources of high-frequency synchrotron emission. It is hard to distinguish observationally between synchrotron and inverse-Compton radiation, and there is ongoing disagreement about what processes we are seeing in some objects, particularly in the X-ray."[22]
"The process(es) that produce the population of relativistic, non-thermal particles that give rise to synchrotron and inverse-Compton radiation are collectively known as particle acceleration. Fermi acceleration is one plausible particle acceleration process in radio-loud active galaxies."[22]
Earth
"This composite picture [at right] shows the radio sky above an old optical photograph of the NRAO site in Green Bank, WV. The former 300 Foot Telescope (the large dish standing between the three 85 foot interferometer telescopes on the left and the 140 Foot Telescope on the right) made this 4.85 GHz radio image, which is about 45 degrees across. Increasing radio brightness is indicated by lighter shades to indicate how the sky would appear to someone with a "radio eye" 300 feet in diameter."[23]
"The visible and radio skies reveal quite different "parallel universes" sharing the same space. Most bright stars are undetectable at radio wavelengths, and many strong radio sources are optically faint or invisible. Familiar objects like the Sun and planets can look quite different through the radio and optical windows. The extended radio sources spread along a band from the lower left to the upper right in this picture lie in the outer Milky Way. The brightest irregularly shaped sources are clouds of hydrogen ionized by luminous young stars. Such stars quickly exhaust their nuclear fuel, collapse, and explode as supernovae, whose remnants appear as faint radio rings. Unlike the nearby (distances < 1000 light years) stars visible to the human eye, almost none of the myriad "radio stars" (unresolved radio sources) scattered across the sky are actually stars. Most are extremely luminous radio galaxies or quasars, and their average distance is over 5,000,000,000 light years. Radio waves travel at the speed of light, so distant extragalactic sources appear today as they actually were billions of years ago. Radio galaxies and quasars are beacons carrying information about galaxies and their environs, everywhere in the observable universe and ever since the first galaxies were formed."[23]
Electrons moving along a Birkeland current may be accelerated by a plasma double layer. If the resulting electrons approach relativistic velocities (i.e. if they approach the speed of light) they may subsequently produce a Bennett pinch, which in a magnetic field causes the electrons to spiral and emit synchrotron radiation that may include radio, optical (i.e. visible light), x-rays, and gamma rays.
Jupiter
In 1955, Bernard Burke and Kenneth Franklin detected bursts of radio signals coming from Jupiter at 22.2 MHz.[3] The period of these bursts matched the rotation of the planet, and they were also able to use this information to refine the rotation rate. Radio bursts from Jupiter were found to come in two forms: long bursts (or L-bursts) lasting up to several seconds, and short bursts (or S-bursts) that had a duration of less than a hundredth of a second.[24]
Between September and November 23, 1963, Jupiter is detected by radar astronomy.[25]
"The dense atmosphere makes a penetration to a hard surface (if indeed one exists at all) very unlikely. In fact, the JPL results imply a correlation of the echo with Jupiter ... which corresponds to the upper (visible) atmosphere. ... Further observations will be needed to clarify the current uncertainties surrounding radar observations of Jupiter."[25]
"Although in 1963 some claimed to have detected echoes from Jupiter, these were quite weak and have not been verified by later experiments."[26]
"A search for radar echoes from Jupiter at 430 MHz during the oppositions of 1964 and 1965 failed to yield positive results, despite a sensitivity several orders of magnitude better than employed by other groups in earlier (1963) attempts at higher frequencies. ... [I]t might be suspected that meteorological disturbances of a random nature were involved, and that the echoes might be returned only in exceptional circumstances. Further support for this point of view may be gleaned from the fact that JPL found positive results for only 1 (centered at 32° System I longitude) of the 8 longitude regions investigated in 1963 (Goldstein 1964) and, in fact, had no success during their observations in 1964 (see comment by Goldstein following Dyce 1965)."[27]
Interplanetary mediums
Interplanetary scintillation refers to random fluctuations in the intensity of radio waves of celestial origin, on the timescale of a few seconds. It is analogous to the twinkling one sees looking at stars in the sky at night, but in the radio part of the electromagnetic spectrum rather than the visible one. Interplanetary scintillation is the result of radio waves traveling through fluctuations in the density of the electron and protons that make up the solar wind.
Scintillation occurs as a result of variations in the refractive index of the medium through which waves are traveling. The solar wind is a plasma, composed primarily of electrons and lone protons, and the variations in the index of refraction are caused by variations in the density of the plasma.[28] Different indices of refraction result in phase changes between waves traveling through different locations, which results in interference. As the waves interfere, both the frequency of the wave and its angular size are broadened, and the intensity varies.[29]
Interstellar medium
Radio astronomy has resulted in the detection of over a hundred interstellar species, including radicals and ions, and organic (i.e. carbon-based) compounds, such as alcohols, acids, aldehydes, and ketones. One of the most abundant interstellar molecules, and among the easiest to detect with radio waves (due to its strong electric dipole moment), is CO (carbon monoxide). In fact, CO is such a common interstellar molecule that it is used to map out molecular regions.[30] The radio observation of perhaps greatest human interest is the claim of interstellar glycine,[31] the simplest amino acid, but with considerable accompanying controversy.[32] One of the reasons why this detection [is] controversial is that although radio (and some other methods like rotational spectroscopy) are good for the identification of simple species with large dipole moments, they are less sensitive to more complex molecules, even something relatively small like amino acids.
"Interstellar gas in our Galaxy [shown at right] emits spectral lines as well as continuum noise. Neutral hydrogen (HI) gas is ubiquitous in the disk. The brightness of the λ ~ 21 cm hyperfine line at ~ 1420.4 MHz is proportional to the column density of HI along the line of sight and is nearly independent of the gas temperature. It is not affected by dust absorption, so we can see the HI throughout our Galaxy and nearby external galaxies."[23]
"Red indicates directions of high HI column density, while blue and black show areas with little hydrogen. The figure is centered on the Galactic center and Galactic longitude increases to the left. Some of the hydrogen loops outline old supernova remnants."[23]
Milky Way
"The cosmic static discovered by Karl Jansky is dominated by diffuse emission orginating in and near the disk of our Galaxy. The distribution of 408 MHz continuum emission shown [at right] in Galactic coordinates is expected since we are located in the disk of a galaxy similar to the edge-on galaxy NGC 4565".[23]
"This all-sky 408 MHz continuum image [at right] is shown in Galactic coordinates, with the galactic center in the middle and the galactic disk extending horizontally from it."[23]
Galaxies
The hotspots that are usually seen in FRII sources are interpreted as being the visible manifestations of shocks formed when the fast, and therefore supersonic, jet (the speed of sound cannot exceed c/√3) abruptly terminates at the end of the source, and their spectral energy distributions are consistent with this picture.[33]
"Radio galaxies (and, to a lesser extent, radio-loud quasars) display a wide range of structures in radio maps. The most common large-scale structures are called lobes: these are double, often fairly symmetrical, roughly ellipsoidal structures placed on either side of the active nucleus. A significant minority of low-luminosity sources exhibit structures usually known as plumes which are much more elongated. Some radio galaxies show one or two long narrow features known as jets (the most famous example being the giant galaxy M87 in the Virgo cluster) coming directly from the nucleus and going to the lobes. Since the 1970s (Scheuer 1974, Blandford & Rees 1974) the most widely accepted model has been that the lobes or plumes are powered by beams of high-energy particles and magnetic field coming from close to the active nucleus. The jets are believed to be the visible manifestations of the beams, and often the term jet is used to refer both to the observable feature and to the underlying flow."[22]
"Radio sources were divided by Fanaroff & Riley (1974) into two classes, now known as Fanaroff and Riley Class I (FRI), and Class II (FRII). The distinction was originally made based on the morphology of the large-scale radio emission (the type was determined by the distance between the brightest points in the radio emission): FRI sources were brightest towards the centre, while FRII sources were brightest at the edges. Fanaroff & Riley observed that there was a reasonably sharp divide in luminosity between the two classes: FRIs were low-luminosity, FRIIs were high luminosity. With more detailed radio observations, the morphology turns out to reflect the method of energy transport in the radio source. FRI objects typically have bright jets in the centre, while FRIIs have faint jets but bright hotspots at the ends of the lobes. FRIIs appear to be able to transport energy efficiently to the ends of the lobes, while FRI beams are inefficient in the sense that they radiate a significant amount of their energy away as they travel."[22]
"In more detail, the FRI/FRII division depends on host-galaxy environment (Owen & Ledlow 1994) in the sense that the FRI/FRII transition appears at higher luminosities in more massive galaxies. FRI jets are known to be decelerating in the regions in which their radio emission is brightest (e.g. Laing & Bridle 2002) and so it seems that the FRI/FRII transition reflects whether a jet/beam can propagate through the host galaxy without being decelerated to sub-relativistic speeds by interaction with the intergalactic medium. From analysis of relativistic beaming effects, the jets of FRII sources are known to remain relativistic (with speeds of at least 0.5c) out to the ends of the lobes. The hotspots that are usually seen in FRII sources are interpreted as being the visible manifestations of shock]s formed when the fast, and therefore supersonic, jet (the speed of sound cannot exceed c/√3) abruptly terminates at the end of the source, and their spectral energy distributions are consistent with this picture (Meisenheimer et al. 1989). Often multiple hotspots are seen, reflecting either continued outflow after the shock or movement of the jet termination point: the overall hotspot region is sometimes called the hotspot complex."[22]
"Names are given to several particular types of radio source based on their radio structure:"[22]
- Classical double refers to an FRII source with clear hotspots.
- Wide-angle tail normally refers to a source intermediate between standard FRI and FRII structure, with efficient jets and sometimes hotspots, but with plumes rather than lobes, found at or near the centres of clusters.
- Narrow-angle tail or Head-tail source describes an FRI that appears to be bent by ram pressure as it moves through a cluster.
- Fat doubles are sources with diffuse lobes but neither jets nor hotspots. Some such sources may be relics whose energy supply has been permanently or temporarily turned off.
Radiation astromathematics
Ions accelerating past each other at relativistic speeds generate synchrotron radiation. Depending on the ion concentration, this radiation may contribute significantly to stellar spectra as may cyclotron or bremsstrahlung radiation from similar ion and electron interactions at slower speeds.
3C 48
{{free media}}3C48 is a quasar discovered in 1960; it was the second source conclusively identified as such.[34]
3C48 was the first source in the Third Cambridge Catalogue of Radio Sources for which an optical identification was found in 1960 through interferometry.[35] It had a redshift of 0.367, making it one of the highest redshift sources then known.[36] It was not until 1982 that the surrounding faint galactic "nebulosity" was confirmed to have the same redshift as 3C48, cementing its identification as an object in a distant galaxy.[37] This was also the first solid identification of a quasar with a surrounding galaxy at the same redshift.
3C 48 is one of four primary calibrators used by the Very Large Array (along with 3C 138, 3C 147, and 3C 286). Visibilities of all other sources are calibrated using observed visibilities of one of these four calibrators.[38]
3C 66A
In particular, the innermost two jet components of two TeV-emitting BL Lacs in our sample: 0219+428 (3C 66A) [at right] and 1219+285 (W Comae) are both inward-moving. The small velocities and core separations of these moving components may indicate that the core is not a stable reference point in these two jets."[39]
3C 75
{{free media}}3C 75 may be X-ray source 2A 0252+060 (1H 0253+058, XRS 02522+060).[40]
"What's happening at the center of active galaxy 3C 75? The two bright sources at the center of this composite x-ray (blue)/ radio (pink) image are co-orbiting supermassive black holes powering the giant radio source 3C 75. Surrounded by multimillion degree x-ray emitting gas, and blasting out jets of relativistic particles the supermassive black holes are separated by 25,000 light-years. At the cores of two merging galaxies in the Abell 400 galaxy cluster they are some 300 million light-years away."[41]
3C 111
"VLBA images of the jet in the broad-line radio galaxy 3C 111. The picture shows the variable parsec-scale structure of the jet in this active galactic nucleus. The features observed correspond to ejected plasma regions traveling at relativistic speeds. Those appear to be larger than the speed of light due to projection effects. The sixteen images are spaced by their relative time intervals. The images show that a major radio flux-density outburst in 1996 was followed by a particularly bright plasma ejection associated with a superluminal jet component. This major event was followed by trailing features in its evolution. A similar event is seen after mid 2001. The jet dynamics in this source is revealed: a plasma injection into the jet beam leads to the formation of multiple shocks that travel at different speeds downstream (ranging from 3c to 6c) and interact with each other and with the ambient medium. This is in agreement with numerical relativistic magnetohydrodynamic structural and emission simulations of jets."[42]
"Images were taken at 15 GHz with the full Very Long Baseline Array as part of the 2cm Survey/MOJAVE collaboration. The observing runs usually last 8 hr and the total observing time on source is approximately 50 minutes. The typical dynamic range in the images is of 1000:1 (the lowest shown flux density is typically of 1-2 mJy/beam). The images are convolved with a common restoring beam of 0.5x1.0 milliarcseconds (P.A. of 0 deg). The image alignment is (arbitrary) to the brightness peak. The superluminal speeds of the features in the jet were determined from a detailed analysis of multiple Gaussian model fits to the observed visibilities."[42]
3C 123
{{free media}}3C 123 is a strong radio source. It is surrounded by three other, even weaker galaxies.
The initial estimation of the Doppler shift (z = 0.637) indicated that it is the furthest-known (then mid-70s) galaxy, located within 8 billion light years, 5 to 10 times the size of our Galaxy, and as a radio source about 4 times stronger than Cygnus A [43]. Subsequent investigations clarified the value of about 0.218, that is, the galaxy is much closer to the Earth and is not as large as previously thought.
3C 273
The first quasars (3C 48 and 3C 273) were discovered in the late 1950s, as radio sources in all-sky radio surveys.[44][45][46][47] With small telescopes and the Lovell Telescope as an interferometer, they were shown to have a very small angular size.[48]
Measurements taken during one of the occultations by the Moon using the Parkes Radio Telescope allowed a visible counterpart to the radio source to be found and an optical spectrum using the 200-inch Hale Telescope on Mount Palomar to be obtained which revealed the same strange emission lines that were likely ordinary spectral lines of hydrogen redshifted by 15.8 percent - an extreme redshift never seen in astronomy before such that if this was due to the physical motion of the "star", then 3C 273 was receding at an enormous velocity, around 47,000 km/s, far beyond the speed of any known star and defying any obvious explanation.[49]
“Maps of the radio structure of the quasar 3C273 provide evidence of a superluminal expansion during the period 1977-1980. The superluminal expansion might be attributed to the movement of a single knot away from the nucleus along the jet. The apparent constant velocity of 10 times the speed of light is an important constraint on theories of apparent superluminal expansion.”[50]
3C 279
"Superluminal motion in quasar 3C279 is shown [at right] in a "movie" mosaic of five radio images made over seven years. The stationary core is the bright red spot to the left of each image. The observed location of the rightmost blue-green blob moved about 25 light years from 1991 to 1998, hence the changes appear to an observer to be faster than the speed of light or "superluminal". The motion is not really faster than light, the measured speed is due to light-travel-time effects for a source moving near the speed of light almost directly toward the observer. The blue-green blob is part of a jet pointing within 2 degrees to our line of sight, and moving at a true speed of 0.997 times the speed of light. These five images are part of a larger set of twenty-eight images made with the VLBA and other radio telescopes from 1991 to 1997 to study the detailed properties of this energetic quasar."[51] The images are in the K band, 1.2 cm, 22 GHz.[51]
3C 295
{{free media}}
3C 295 is a strongly X-ray emitting galaxy cluster in the constellation Boötes. 3C 295 (Cl 1409+524) is one of the most distant galaxy clusters observed by X-ray telescopes. The cluster is filled with a vast cloud of 50 MK gas that radiates strongly in X rays. [The Chandra X-ray Observatory detected] that the central galaxy is a strong, complex source of X rays. The cluster is located at J 2000.0 RA 14h 11m 20s Dec −52° 12' 21". Observation date for the Chandra image is August 30, 1999.
3C 345
"Tracking the features within small-scale jets has revealed interesting complications. The paths are not always radial to the nucleus, usually taken as the source with the flattest spectrum in ambiguous cases. This is based on the general principle that synchrotron spectra are flattened at lower frequencies by self-absorption, so the densest plasma will have a flat or inverted spectrum. An interesting case is 3C 345 [at right], in which emission features repeatedly appear off the core and follow fairly consistent nonradial paths. [...] a new component appears in late 1985, brightens, and moves outward changing its relative position angle in the process".[10]
"VLBI (very-long-baseline interferometry) observations between 1971 and 1983 have been used to determine the positions of the 'core' of the quasar 3C345 relative to the more distant compact quasar NRAO512 with a fractional uncertainty as small as two parts in a hundred million. The core of 3C345 appears stationary in right ascension to within 20 arc microsec/yr, a subluminal bound corresponding to 0.7c. The apparent velocities of the jets are superluminal, up to 14c in magnitude."[52]
3C 380
"The quasar 3C 380 (B1828+487) [at right] has a complicated, convoluted structure on kiloparsec scales which is consistent with it being a moderate-sized classical double source seen approximately end on [...] 6 cm images from 1982.9 to 1993.4 (the 1990.8 image appears [at right] reveal a highly complex, filamentary, structure which exhibits rapid local brightness changes over its entire ~ 100 pc length. Motion [occurs] in three regions of the jet
- C12, at a distance [...] from the core C appears to move outwards with a velocity of [0.85 c,]
- The bright component A, [...] moves with an apparent velocity [of 4.4±0.5 c, and]
- the peak of emission in the region F [...] appears to move with an apparent velocity of [6.0±0.3 c.]"[53]
For "most of the period between 1982.9 and 1993.4 A moved outwards from C along P.A. 330±1° with little change in the speed or the direction of the apparent velocity vector. In 1988.4 however, A had doubled in brightness and apparently became dissociated from the underlying jet pattern appearing edge-brightened towards the East. This change was accompanied by an apparent deceleration by almost 50%. Between 1988.4 and 1990.8 A apparently accelerated again but its brightness barely changed and by 1990.8 its brightness peak had shifted back to its "standard" P.A. and continued in this direction through 1992.7 and 1993.4 with no significant changes in the velocity and only a slight decrease in flux density. The apparent acceleration from ≃ [0.85 c] at a few pc to ≃ [6.0 c] at [100 pc] is similar to that seen in the best-studied superluminal source 3C 345".[53]
There "are gross changes in the brightness structure of the jet taking place very quickly. For example in three epochs (1988.2, 1990.8 and 1993.4) the jet appears to be bifurcated or edge-brightened in regions B and D while in others it is center-brightened. [...] the rapid brightness changes may be due to phase effects at the intersection of these shocks".[53]
3C 390
"For the 1989.29 VLBI observation we simultaneously used the VLA at 5 GHz in its normal B-configuration synthesis mode to obtain an image of the large scale structure of 3C390.3 with angular resolution of 1.2". We observed the source nearly continuously for 14 hours, except for a 5 min observation of 1803+784 as a phase and amplitude calibrator twice per hour."[54]
3C 405
{{free media}}
Cygnus A (Third Cambridge Catalogue of Radio Sources 3C 405) is a radio galaxy, and one of the strongest radio sources in the sky, along with Cassiopeia A, and Puppis A were the first "radio stars" identified with an optical source; of these, Cygnus A became the first radio galaxy; the other two being nebulae inside the Milky Way.[55] It is a double source,[56] contains an active galactic nucleus and a supermassive black hole at the core with a mass of (2.5±0.7)×109 M☉.[57]
Radio images show two jets protruding in opposite directions from the galaxy's center, extending many times the width of the portion of the host galaxy which emits radiation in the visible.[58] At the ends of the jets are two lobes with "hot spots" of more intense radiation at their edges, formed when material from the jets collides with the surrounding intergalactic medium.[59]
In 2016, a radio transient was discovered 460 parsecs away from the center of Cygnus A, between 1989 and 2016, the object, cospatial with a previously-known infrared source, exhibited at least an eightfold increase in radio flux density, with comparable luminosity to the brightest known supernova, but, the rate of brightening is unknown, the object has remained at a relatively constant flux density since its discovery, consistent with a second supermassive black hole orbiting the primary object, with the secondary having undergone a rapid accretion rate increase, where the inferred orbital timescale is of the same order as the activity of the primary source, suggesting the secondary may be perturbing the primary and causing the outflows.[60]
"Many objects with jets, especially the powerful FR II radio sources with long and highly collimated jets, show hot spots - compact enhancements in brightness of the lobes. Cygnus A [at right] is a prime example. These may in turn have internal structure, and often have the flattest spectra (thus most energetic particle populations) in the extended lobes. They have been pictures as encounter surfaces between the jet flows and a mostly unseen surrounding medium, with compression of the magnetic field occurring and thus vastly increased emissivity. Some (such as Pictor A) have such high-energy electron populations that sychrotron emission continues through the optical into the X-ray regime."[10]
Cygnus A "is the most powerful radio galaxy on our corner of the Universe, used as a point of departure for studying radio galaxies at great distances. At a redshift z=0.0565 (distance of about 211 Mpc or 700 million light-years), its nature remains mysterious enough. The first photographs of Cygnus A showed two clumps of luminous material, which led [to the speculation] that the radio emission was somehow linked to a galaxy collision. [Or,] a poorly resolved version of Centaurus A, bisected by a thick dust lane. The HST image shown as an inset [in the image at right] reveals much detail, but doesn't quite clear the matter up. We see dust and an odd Z-shaped pattern. Much of this light in some regions comes not from stars, but from gas ionized by the nucleus. This is a narrow-line radio galaxy, but infrared and polarization measurements show that from some directions it would appear as a broad-line object and perhaps as a quasar, so that there is plenty of radiation in some directions to light up the gas."[61]
"Cygnus A is an excellent example of the Fanaroff-Riley (FR) type II radio sources, characterized by faint, very narrow jets, distinct lobes, and clear hot spots at the outer edges of the lobes, often where the jets intersect the outer edges. These are in general more powerful radio sources than the FR I objects [...], with the difference being frequently attributed to faster (relativistic?) motion of the jet material in the stronger FR II sources. The radio/optical overlay highlights the extent of the radio source beyond the central galaxy, extending 140 kpc (500,000 light-years) if we see it sideways."[61]
3C 459
{{fairuse}}"The spectral index distribution between 408 and 4885 MHz [of 3C 459 was] made by convolving the VLA image to a resolution of 0.62 arcsec."[62]
Radio galaxy 3C459 "has a very asymmetric radio structure, a high infrared luminosity and a young stellar population. The eastern component of the double-lobed structure is brighter, much closer to the nucleus and is significantly less polarized than the western one. This is consistent with the jet on the eastern side interacting with dense gas, which could be due to a merged companion or dense cloud of gas."[62]
The "radio structure of the source comprises a core and two extended lobes, the eastern one being a factor of ∼5 closer to the core than the western lobe and the whole source extending to approximately 8.2 arcsec. This corresponds to a linear size of 19.5 kpc, which is similar to other compact steep-spectrum objects. At the VLA resolution of ∼0.4 arcsec at λ6 cm, the eastern lobe, though significantly resolved, appears to have a smooth structure with no discernible small-scale features. The western lobe, extending half-way back to the core has a tail with two peaks of emission. The higher-resolution λ2 cm image of U85 shows the source to have an edge-brightened, FRII structure, consistent with its radio luminosity of 2.1 × 1025 W Hz−1 sr−1 at 1400 MHz. It is worth noting that the central component, which contributes ∼30 per cent of the total flux density at 5 GHz, has a steep radio spectrum with a spectral index, α (S∝ να), of −0.78±0.15 between λ6 and 2 cm (U85). 3C459 also exhibits a high degree of polarization asymmetry between the two lobes (Davis, Stannard & Conway 1983; U85; Morganti et al. 1999). It has an integrated rotation measure of −6±1 rad m−2 with an intrinsic position angle (PA) of 7±3° (Simard-Normandin, Kronberg & Button 1981)."[62]
NGC 315
The image at right is of apparent superluminal motion in NGC 315. In both of these images the apparent motion is rectilinear or close to it. NGC 315 is a low-luminosity radio galaxy.
NGC 1068
"Measurements of the polarization of the light near the nucleus of NGC 1068, a nearby and prototypical type 2 Seyfert, provided strong evidence that it actually contains a type 1 nucleus which is blocked from our direct view by an obscuring ring or torus of material. The nucleus produces a radio jet at right angles to this hypothesized torus, which must lie almost at right angles to the galaxy's disk plane. Recent VLBI observations may have detected this torus, as shown in this montage. HST images are used to show the galaxy as a whole and the conelike illumination pattern of highly ionized gas which must see the nucleus directly, then the radio jet and finally a tiny structure which has the right size, orientation, and temperature to be the obscuring disk. If this in fact the obscuring material, this is an important piece of evidence for the unified scheme for Seyfert galaxies. This is simply the notion that many type 2 Seyferts would be type 1 objects if we could see them from the proper direction, nearly along the axis of the torus so that our view is not blocked. These special directions are often marked by both radio jets and cones of intense radiation, which we see either as they ionize ambient gas or are reflected from clouds rich in dust that happen to lie within the cones."[63]
NGC 1316
{{fairuse}}"This image [on the right] was made from a single beam [radio] observation of NGC 1316 (Fornax A). It displays the classic “double lobed” shape that we believe arises from oppositely-directed jets of material being ejected from the accretion disk around a central super-massive black hole. The telescope observed NGC1316 for 10 hours at a centre frequency of 944 MHz with 288 MHz of bandwidth. Situated at the Murchison Radioastronomy Observatory, ASKAP has almost no radio frequency interference in this band and very little flagging was required. The bandpass was calibrated using an observation of PKS B1934-638, but no other calibration method has been used. The data were de-convolved using a combination of Hogbom CLEAN and the maximum entropy method. No Taylor terms were used, but some W-terms were required due to the large primary beam size (nearly 2 degrees in diameter). This image contains all of ASKAP’s longest and shortest baselines, making the synthesised beam size 12”x10”. The noise in the background of the image has an RMS of 25 uJy/beam, which is close to the thermal expectation for robust zero weighting."[64]
"The radio galaxy Fornax A is one of the brightest in the sky and has the advantage of being much closer to our own galaxy the Milky Way. If we could see Fornax A in the sky with our naked eyes then each of its two lobes would be about the same size as a full moon. It is close enough that ASKAP can resolve extended structure, demonstrating the telescope’s ability to detect diffuse emission as well as compact objects. Furthermore, as each of the 36 available ASKAP beams can see a region of sky that is about 4 full-moon-spans across, the source can be easily observed within a single beam. Observations of the source had been requested by our international science teams and the CASS commissioning team decided it would be a good target for our single-beam demonstration."[64]
NGC 4151
"Seyfert galaxies were originally noted for the strength and broadening of their emission lines, and as a class were later characterized by the high ionization states of many of the atomic and ionized species producing these lines. This composite spectrum of the archetypal Seyfert NGC 4151 shows the wide variety of emission lines present, from the Lyman limit at 912 A to the mid-infrared at about 9 microns. It uses spectra taken with apertures several arcseconds in size, so as to reproduce the usual spectrum mixing broad and narrow-line components. From 912-1800 A, the data come from the Shuttle-borne Hopkins Ultraviolet Telescope; from 1800-3200 A, from the mean of three measurements by the International Ultraviolet Explorer (IUE) taken at similar brightness levels; from 3200-4000A, from an observation at Kitt Peak National Observatory, with the continuum rescaled to match the adjacent spectra; from 4000-8000 A, a CCD observation obtained at the Lick Observatory 3-m Shane telescope by Alexei Filippenko; from 8000 A to 1 microns, an observation using the same telescope by Donald Osterbrock and collaborators, carefully corrected for atmospheric absorption; from 0.9-2.4 microns, measurements by Rodger Thompson at Steward Observatory's 2,3-m Bok telescope, and on into the infrared, from the Infrared Space Observatory provided by Eckhard Sturm. Because NGC 4151 is irregularly variable, some of the spectral components have been scaled to make the various pieces match for this presentation (so the relative strengths of lines in very different spectral regions may not be accurate)."[65]
"Some of the most prominent emission lines are marked for reference. The permitted lines - those that can be produced at high densities by astronomical standards - show both brad and narrow components. The strongest of these are the hydrogen recombination lines, such as Lyman alpha at 1216 A, H-beta at 4861, and H-alpha at 6563, plus the strong ultraviolet lines of C IV at 1549 and Mg II at 2800. Other features produced only by very rarefied gas at densities of 1000 atoms per cubic centimeter or so - the forbidden lines, denoted by brackets - arise in regions with less velocity structure and are narrower. Some strong examples are [O III] at 4959 and 5007 A, [O II] at 3727, [Ne V] at 3426, and [S III] at 9060 and 9532."[65]
"The spectra of active galactic nuclei are noteworthy in showing species with a large range in ionization at once, from neutral ions such as [O I] and [N I] to highly ionized cases such as [Ne V] and [O VI]. Even hot stars such as light up gaseous nebulae in our galaxy cannot ionize gas as highly as these ions require, so that both a strong source of hard radiation and a wide range in gas density must be present to see such spectra."[65]
"NGC 4151 is a bit unusual in showing strong absorption in several lines, especially Lyman alpha and C IV. The absorption is blueshifted with respect to the line centers, so that it arises in some kind of wind or other gaseous outflow."[65]
NGC 5846
.jpg)
{{free media}}NGC 5846 is the foremost galaxy of the large galaxy group known as the NGC 5846 group which includes NGC 5813, NGC 5831, NGC 5845, and NGC 5854.[66] The group has two subgroups, one centered around the elliptical NGC 5813 and the other around NGC 5846, lying at a projected separation of 600 kpc.[67] The group is part of the Virgo III Groups, a very obvious chain of galaxy groups on the left side of the Virgo cluster, stretching across 40 million light years of space.[68]
In the image on the left of NGC 5846, white crosses mark the detected CO cloud positions.[69]
The galaxy has complex X-ray morphology[70] that is considered to be the result of AGN outflows. Two inner bubbles in the hot gas, at a distance of 600 pc from the center and filled with radio emission, are clear indications of recent AGN feedback. A weak radio source, elongated in the NE–SW direction, connects the inner cavities. X-ray-bright rims surround the inner X-ray bubbles.[71] Many X-ray knots are visible, suggesting cooling sites. The scenario indicated by the Chandra observation is that of an AGN outflow, compressing and cooling the gas[72] in the central ~2 kpc (20" at the distance of NGC 5846).[69]
"A beautiful new image of two colliding galaxies [second down on the right] has been released by NASA's Great Observatories. The Antennae galaxies, located about 62 million light-years from Earth, are shown in this composite image from the Chandra X-ray Observatory (blue), the Hubble Space Telescope (gold and brown), and the Spitzer Space Telescope (red). The Antennae galaxies take their name from the long antenna-like "arms," seen in wide-angle views of the system. These features were produced by tidal forces generated in the collision."[73]
"The collision, which began more than 100 million years ago and is still occurring, has triggered the formation of millions of stars in clouds of dust and gas in the galaxies. The most massive of these young stars have already sped through their evolution in a few million years and exploded as supernovas."[73]
"The X-ray image from Chandra shows huge clouds of hot, interstellar gas that have been injected with rich deposits of elements from supernova explosions. This enriched gas, which includes elements such as oxygen, iron, magnesium, and silicon, will be incorporated into new generations of stars and planets. The bright, point-like sources in the image are produced by material falling onto black holes and neutron stars that are remnants of the massive stars. Some of these black holes may have masses that are almost one hundred times that of the Sun."[73]
"The Spitzer data show infrared light from warm dust clouds that have been heated by newborn stars, with the brightest clouds lying in the overlapping region between the two galaxies."[73]
"The Hubble data reveal old stars and star-forming regions in gold and white, while filaments of dust appear in brown. Many of the fainter objects in the optical image are clusters containing thousands of stars."[73]
"The Chandra image was taken in December 1999. The Spitzer image was taken in December 2003. The Hubble image was taken in July 2004 and February 2005."[73]
OJ 287
"[S]uperluminal motion for each of [two] knots, [in the BL Lacertae object OJ 287 is suggested] at an angular speed of 0.28 mas yr-1, corresponding to βapp = vapp/c ≃ 3.3h-1 (for z = 0.306, H0 = 100h km s-1 Mpc-1, and q0 = 0.5)."[74] "Superluminal motion for each knot, with an apparent velocity ~3.3h-1c, is suggested by the polarization data. The polarizations of C [the core] and K2 [knot two] changed markedly over the year between observations."[74]
Subsequent VLBI "observations of the total intensity structure of the BL Lacertae object OJ 287 have been made with an angular resolution of 7 x 1 mas at λ6 cm. The source consists of a core and three knots in a VLBI jet at position angle θ ≃ -100°. Previously suspected superluminal motion in the outer two knots at βapph ≃ 3 ... has been confirmed."[75]
For the speeds in units of c, β = v/c, "[i]n the usual interpretation of superluminal motion, the apparent velocity is given by
- <math>\beta_{app} = { \beta_{jet} \sin \phi \over 1 - \beta_{jet} \cos \phi },</math>
where βjetc is the jet velocity, and the jet makes an angle Φ to the line of sight."[75]
In April 2010, radio astronomers working at the Jodrell Bank Observatory of the University of Manchester reported an unknown object in M82. The object has started sending out radio waves, and the emission does not look like anything seen anywhere in the universe before.[76] There have been several theories about the nature of this unknown object, but currently no theory entirely fits the observed data.[76] It has been suggested that the object could be a "micro quasar", having very high radio luminosity yet low X-ray luminosity, and being fairly stable.[77] However, all known microquasars produce large quantities of X-rays, whereas the object's X-ray flux is below the measurement threshold.[76] The object is located at several arcseconds from the center of M82. It has an apparent superluminal motion of 4 times the speed of light relative to the galaxy center.[78]
S4 0003+38
At right is a radio image of quasar S4 0003+38.[39] This object was image on March 9 and December 1, 2006, March 28 and August 24, 2007, May 1 and July 17, 2008, March 25, 2009, and July 12, 2010. From its movement as it was leaving its source in µas y-1, S4 0003+38 before it left its source was moving at 2.62±0.84c, left its source at a back projected date of 2003.01±0.24, continued accelerating to 4.63±0.32c, then began to decelerate successively at each observation epoch from 0.67±0.20, 0.36±0.32, to 0.16±0.26.[39]
Gorgergrat
The recent history period dates from around 1,000 b2k to present.
The Kulmhotel Gornergrat, atop Gorgergrat, which is both mountain and ski slope, is also home to two observatories. The Kölner Observatorium für SubMillimeter Astronomie (KOSMA) [at right] is a 3-m radio telescope located at 3,135 m on Gornergrat near Zermatt (Switzerland) in the southern tower (nearest to the camera).
"Because of the good climatic conditions at the altitude of 3135 m (10285 ft), astronomical observatories have been located in both towers of the “Kulmhotel” at Gornergrat since 1967. In 1985, the KOSMA telescope was installed in the southern tower by the Universität zu Köln and, in the course of 1995, replaced by a new dish and mount."[79]
"The KOSMA telescope with its receivers and spectrometers was dedicated to observe interstellar and atmospheric molecular lines in the millimeter and submillimeter wavelength range. After 25 years of a successful era came to an end (June 2nd, 2010). The 3m KOSMA Radio Telescope left the Gornergrat and joined his long journey to Yangbajing / Lhasa / Tibet."[79]
"Chinese and German scientists are establishing an astronomical observatory in a Tibetan county 4,300 meters above sea level."[80]
"Tibet is an ideal location because the water deficit in its air ensures superb atmospheric transparency and creates a comparatively stable environment for research in the areas of astrophysics, high-energy and atmospheric physics."[81]
"The observatory would house a KOSMA 3-meter sub-millimeter-wave telescope, the first of its kind to be used in general astronomical observation in China."[81]
Radio observatories
The "Arecibo Observatory in Puerto Rico [is] the world's largest, and most sensitive, single-dish radio telescope."[82]
"The 1,000-foot-diameter (305 meters) Arecibo telescope [... provides] access to state-of-the-art observing for scientists in radio astronomy, solar system radar and atmospheric studies, and the observatory has the unique capability for solar system and ionosphere (the atmosphere's ionized upper layers) radar remote sensing."[82]
"It contains the largest curved focusing dish on Earth, giving Arecibo the largest electromagnetic-wave-gathering capacity.[83] The dish surface is made of 38,778 perforated aluminum panels, each measuring about 3 by 6 feet (1 by 2 m), supported by a mesh of steel cables.
The telescope has three radar transmitters, with effective isotropic radiated powers of 20 TW at 2380 MHz, 2.5 TW (pulse peak) at 430 MHz, and 300 MW at 47 MHz. The telescope is a spherical reflector, not a parabolic reflector. To aim the telescope, the receiver is moved to intercept signals reflected from different directions by the spherical dish surface. A parabolic mirror would induce a varying astigmatism when the receiver is in different positions off the focal point, but the error of a spherical mirror is the same in every direction.
The receiver is located on a 900-ton platform which is suspended 150 m (500 ft) in the air above the dish by 18 cables running from three reinforced concrete towers, one of which is 110 m (365 ft) high and the other two of which are 80 m (265 ft) high (the tops of the three towers are at the same elevation). The platform has a 93-meter-long rotating bow-shaped track called the azimuth arm on which receiving antennas, secondary and tertiary reflectors are mounted. This allows the telescope to observe any region of the sky within a forty-degree cone of visibility about the local zenith (between −1 and 38 degrees of declination). Puerto Rico's location near the equator allows Arecibo to view all of the planets in the Solar System, though the round trip light time to objects beyond Saturn is longer than the time the telescope can track it, preventing radar observations of more distant objects.
Hypotheses
- Synchrotron radiation is prevalent from many astronomical sources.
Acknowledgements
The content on this page was first contributed by: Henry A. Hoff.
Initial content for this page in some instances came from Wikiversity.
See also
References
- ↑ Uwe Arp (June 2003). Synchrotron Radiation. Gaithersburg, Maryland USA: National Institute of Standards and Technology NIST). Retrieved 2014-04-02.
- ↑ Garcia, Leonard N. The Jovian Decametric Radio Emission. NASA. Retrieved 2007-02-18.
- ↑ 3.0 3.1 Linda T. Elkins-Tanton (2006). Jupiter and Saturn. New York: Chelsea House. ISBN 0-8160-5196-8.
- ↑ Klein, M. J.; Gulkis, S.; Bolton, S. J. (1996). Jupiter's Synchrotron Radiation: Observed Variations Before, During and After the Impacts of Comet SL9. NASA. Retrieved 2007-02-18.
- ↑ synchrotron radiation. San Francisco, California: Wikimedia Foundation, Inc. November 10, 2012. Retrieved 2012-12-21.
- ↑ L. Maraschi, G. Ghisellini and A. Celotti (1992). "A jet model for the gamma-ray emitting blazar 3C 279". The Astrophysical Journal. 397 (1): L5–9. Bibcode:1992ApJ...397L...5M. doi:10.1086/186531. Retrieved 2014-01-10. Unknown parameter
|month=ignored (help) - ↑ 7.0 7.1 7.2 7.3 Morrison P (1967). "Extrasolar X-ray Sources". Ann Rev Astron Astrophys. 5 (1): 325. Bibcode:1967ARA&A...5..325M. doi:10.1146/annurev.aa.05.090167.001545.
- ↑ R. M. Thomas (1968). "The Detection of High-Energy X-rays from Ara XR-1 and Nor XR-1". Proceedings of the Astronomical Society of Australia. 1 (12): 156–6. Bibcode:1968PASAu...1..165T. Unknown parameter
|month=ignored (help);|access-date=requires|url=(help) - ↑ 9.0 9.1 K. J. Frost and B. R. Dennis (1971). "Evidence from Hard X-Rays for Two-Stage Particle Acceleration in a Solar Flare". The Astrophysical Journal. 165 (5): 655. Bibcode:1971ApJ...165..655F. doi:10.1086/150932. Unknown parameter
|month=ignored (help);|access-date=requires|url=(help) - ↑ 10.0 10.1 10.2 Bill Keel (October 2003). Jets, Superluminal Motion, and Gamma-Ray Bursts. Tucson, Arizona USA: University of Arizona. Retrieved 2014-03-19.
- ↑ Iosif Shklovskii (1953). "On the Nature of the Crab Nebula's Optical Emission". Doklady Akademii Nauk SSSR. 90: 983. Bibcode:1957SvA.....1..690S.
- ↑ B. J. Burn (1973). "A synchrotron model for the continuum spectrum of the Crab Nebula". Monthly Notices of the Royal Astronomical Society. 165: 421. Bibcode:1973MNRAS.165..421B.
- ↑ http://library.thinkquest.org/27954/dequ.htm
- ↑ http://chemteam.info/Radioactivity/Writing-Alpha-Beta.html
- ↑ Loveland, W., Morrissey, D. J., Seaborg, G. T., Modern Nuclear Chemistry, 2006, John Wiley & Sons, 221.
- ↑ 16.0 16.1 16.2 Helmut Wiedemann (July 4, 2007). Particle Accelerator Physics, Third Edition. Berlin: Springer-Verlag. p. 948. ISBN 978-3-540-49043-2. Retrieved 2011-12-17.
- ↑ 17.0 17.1 S. Y. Lee (2004). Accelerator physics, Second Edition. Singapore: World Scientific Publishing Co. Pte. Ltd. p. 575. ISBN 981-256-182-X. Retrieved 2011-12-17.
- ↑ 18.0 18.1 G. Trottet, Säm Krucker, T. Lüthi, and A. Magun (2008). "Radio Submillimeter and γ-Ray Observations of the 2003 October 28 Solar Flare". The Astrophysical Journal. 678 (1): 509. doi:10.1086/528787. Retrieved 2013-10-22. Unknown parameter
|month=ignored (help) - ↑ [1] Synchrotron Radiation Damping in the LHC 2005 Joachim Tuckmantel.
- ↑ 20.0 20.1 20.2 20.3 20.4 I.A. Smith, R.P.J. Tilanus, J. van Paradijs, T.J. Galama, P.J. Groot, P. Vreeswijk, C. Kouveliotou, R.A.M. Wijers, and N. Tanvir (1999). "SCUBA sub-millimeter observations of gamma-ray bursters I. GRB 970508, 971214, 980326, 980329, 980519, 980703, 981220, 981226". Astronomy and Astrophysics. 347 (07): 92–8. Bibcode:1999A&A...347...92S. Retrieved 2013-10-22. Unknown parameter
|month=ignored (help) - ↑ Cox, A. N., ed. (2000). Allen's Astrophysical Quantities. New York: Springer-Verlag. p. 124. ISBN 0-387-98746-0.
- ↑ 22.0 22.1 22.2 22.3 22.4 22.5 22.6 22.7 22.8 Martin J. Hardcastle (5 February 2006). "Radio galaxies". San Francisco, California: Wikimedia Foundation, Inc. Retrieved 18 July 2019.
- ↑ 23.0 23.1 23.2 23.3 23.4 23.5 S.G. Djorgovski; et al. A Tour of the Radio Universe. National Radio Astronomy Observatory. Retrieved 2014-03-16.
- ↑ Weintraub, Rachel A. (September 26, 2005). How One Night in a Field Changed Astronomy. NASA. Retrieved 2007-02-18.
- ↑ 25.0 25.1 Gordon H. Pettengill & Irwin I. Shapiro (1965). "Radar Astronomy". Annual Review of Astronomy and Astrophysics. 3: 377–410. Bibcode:1965ARA&A...3..377P. Retrieved 2012-12-25.
- ↑ Irwin I. Shapiro (1968). "Planetary radar astronomy". Spectrum, IEEE. 5 (3): 70–9. doi:10.1109/MSPEC.1968.5214821. Retrieved 2012-12-25. Unknown parameter
|month=ignored (help) - ↑ R. B. Dyce and G. H. Pettengill, and A. D. Sanchez (1967). "Radar Observations of Mars and Jupiter at 70 cm" (PDF). The Astronomical Journal. 72 (4): 771–7. Bibcode:1967AJ.....72..771D. doi:10.1086/110307. Retrieved 2012-12-25. Unknown parameter
|month=ignored (help) - ↑ Jokipii (1973), pp. 11–12.
- ↑ Alurkar (1997), p. 11.
- ↑ http://www.cfa.harvard.edu/mmw/CO_survey_aitoff.jpg.
- ↑ Kuan YJ, Charnley SB, Huang HC; et al. (2003). "Interstellar glycine". The Astrophysical Journal. 593 (2): 848–867. Bibcode:2003ApJ...593..848K. doi:10.1086/375637.
- ↑ Snyder LE, Lovas FJ, Hollis JM; et al. (2005). "A rigorous attempt to verify interstellar glycine". The Astrophysical Journal. 619 (2): 914–30. arXiv:astro-ph/0410335. Bibcode:2005ApJ...619..914S. doi:10.1086/426677.
- ↑ Meisenheimer K, Röser H-J, Hiltner PR, Yates MG, Longair MS, Chini R, Perley RA; Roser; Hiltner; Yates; Longair; Chini; Perley (1989). "The synchrotron spectra of radio hotspots". Astronomy and Astrophysics. 219: 63–86. Bibcode:1989A&A...219...63M.
- ↑ Weaver, Kenneth F. (May 1974). "The Incredible Universe". National Geographic. 145 (5): 589–633.
- ↑ Matthews, Thomas A.; Sandage, Allan R. (1963). "Optical Identification of 3c 48, 3c 196, and 3c 286 with Stellar Objects". The Astrophysical Journal. 138: 30–56. Bibcode:1963ApJ...138...30M. doi:10.1086/147615.
- ↑ Greenstein, Jesse L.; Matthews, Thomas A. (1963). "Red-Shift of the Unusual Radio Source 3C48". Nature. 197 (4872): 1041–1042. Bibcode:1963Natur.197.1041G. doi:10.1038/1971041a0.
- ↑ Todd A. Boroson & Oke, J. B. (1982). "Detection of the underlying galaxy in the QSO 3C48". Nature. 296 (5856): 397–399. Bibcode:1982Natur.296..397B. doi:10.1038/296397a0.
- ↑ Witz, Stephan W. (4 December 2015). "Calibration and Flux Density Scale". National Radio Astronomy Observatory. Retrieved 15 May 2016.
- ↑ 39.0 39.1 39.2 M. I. Lister, M. F. Aller, H. D. Aller, D. C. Homan, K. I. Kellermann, Y. Y. Kovalev, A. B. Pushkarev, J. L. Richards, E. Ros, T. Savolainen (2013). "MOJAVE. X. Parsec-Scale Jet Orientation Variations and Superluminal Motion in AGN" (PDF). The Astronomical Journal. Retrieved 2014-03-17.
- ↑ Wood KS; Meekins JF; Yentis DJ; Smathers HW; McNutt DP; Bleach RD (December 1984). "The HEAO A-1 X-ray source catalog". Astrophys. J. Suppl. Ser. 56 (12): 507–649. Bibcode:1984ApJS...56..507W. doi:10.1086/190992.
- ↑ Robert Nemiroff & Jerry Bonnell (9 November 2008). Two Black Holes Dancing in 3C 75. Washington, DC USA: NASA. Retrieved 28 February 2019.
- ↑ 42.0 42.1 M. Kadler, E. Ros, M. Perucho, Y. Y. Kovalev, D. C. Homan, I. Agudo, K. I. Kellermann, M. F. Aller, H. D. Aller, M. L. Lister, J. A. Zensus (September 23, 2005). Superluminal Motions in the Jet of 3C 111. West Virginia USA: National Radio Astronomy Observatory. Retrieved 2014-03-17.
- ↑ "The outermost observed galaxy". Urania. 1. Unknown parameter
|first name=ignored (help); Unknown parameter|data=ignored (|date=suggested) (help); Unknown parameter|last name=ignored (help) - ↑ Shields, Gregory A. (1999). "A BRIEF HISTORY OF AGN". The Publications of the Astronomical Society of the Pacific. 111 (760): 661–678. arXiv:astro-ph/9903401. Bibcode:1999PASP..111..661S. doi:10.1086/316378. Retrieved 3 October 2014.
- ↑ Our Activities. European Space Agency. Retrieved 3 October 2014.
- ↑ Thomas A. Matthews and Allan Sandage (1963). "Optical Identification of 3c 48, 3c 196, and 3c 286 with Stellar Objects". Astrophysical Journal. 138: 30–56. Bibcode:1963ApJ...138...30M. doi:10.1086/147615.
- ↑ Philip Russell Wallace (1991). Physics: Imagination and Reality. ISBN 9789971509293.
- ↑ The MKI and the discovery of Quasars. Jodrell Bank Observatory. Retrieved 2006-11-23.
- ↑ Schmidt Maarten (1963). "3C 273: a star-like object with large red-shift". Nature. 197 (4872): 1040–1040. Bibcode:1963Natur.197.1040S. doi:10.1038/1971040a0.
- ↑ T. J. Pearson, S. C. Unwin, M. H. Cohen, R. P. Linfield, A. C. S. Readhead, G. A. Seielstad, R. S. Simon & R. C. Walker (1981). "Superluminal expansion of quasar 3C273". Nature. 290: 365–8. Bibcode:1981Natur.290..365P. doi:10.1038/290365a0. Unknown parameter
|month=ignored (help);|access-date=requires|url=(help) - ↑ 51.0 51.1 Ann Wehrle; et al. (1998). Apparent Superluminal Motion in 3C279. West Virginia, USA: National Radio Astronomy Observatory. Retrieved 2014-03-16.
- ↑ N. Bartel, T. A. Herring, M. I. Ratner, I. I. Shapiro, and B. E. Corey (1986). "VLBI limits on the proper motion of the 'core' of the superluminal quasar 3C345". Nature. 319 (02): 733–8. Bibcode:1986Natur.319..733B. doi:10.1038/319733a0. Retrieved 2014-03-17. Unknown parameter
|month=ignored (help) - ↑ 53.0 53.1 53.2 A. G. Polatidis and P. N. Wilkinson (1998). J. A. Zensus, G. B. Taylor, & J. M. Wrobel, ed. Superluminal Motion in the Parsec-Scale Jet of 3C 380, In: Radio Emission from Galactic and Extragalactic Compact Sources. Astronomical Society of the Pacific. pp. 77–78. Retrieved 2014-03-18.
- ↑ W. Alef, S. Y. Wu, E. Preuss, K. I. Kellermann, and Y. H. Qiu (1996). "3C 390.3: a lobe-dominated radio galaxy with a possible superluminal nucleus Results from VLA observations and VLBI monitoring at 5GHz". Astronomy and Astrophysics. 308 (04): 376–80. Bibcode:1996A&A...308..376A. Retrieved 2013-12-12. Unknown parameter
|month=ignored (help) - ↑ Astrophysical Journal, "Identification of the Radio Sources in Cassiopeia (A), Cygnus A, and Puppis A", Baade, W.; Minkowski, R., vol. 119, p.206, January 1954, doi:10.1086/145812 , Template:Bibcode
- ↑ Jennison, R.C.; Das Gupta, M.K. (1953). "Fine Structure of the extra-terrestrial radio source Cygnus 1". Nature, Vol. 172. p. 996.
- ↑ Graham, Alister W. (November 2008), "Populating the Galaxy Velocity Dispersion - Supermassive Black Hole Mass Diagram: A Catalogue of (Mbh, σ) Values", Publications of the Astronomical Society of Australia, 25 (4): 167–175, arXiv:0807.2549, Bibcode:2008PASA...25..167G, doi:10.1071/AS08013.
- ↑ Strange, D. "The Radio Galaxy Cygnus "A"". Archived from the original on July 25, 2008. Retrieved 2008-09-22.
- ↑ Nemiroff, Robert; Bonnell, Jerry (2002-10-05). "X-Ray Cygnus A". Astronomy Picture of the Day. Retrieved 2008-09-22.
- ↑ Perley, D. A.; Perley, R. A.; Dhawan, V.; Carilli, C. L. (2017). "Discovery of a Luminous Radio Transient 460 pc from the Central Supermassive Black Hole in Cygnus A". The Astrophysical Journal. 841 (2): 117. arXiv:1705.07901. Bibcode:2017ApJ...841..117P. doi:10.3847/1538-4357/aa725b. ISSN 1538-4357.
- ↑ 61.0 61.1 Bill Keel (October 2003). The powerful radio galaxy Cygnus A. Tucson, Arizona USA: University of Arizona. Retrieved 2014-03-19.
- ↑ 62.0 62.1 62.2 P. Thomasson, D.J. Saikia and T.W.B. Muxlow (11 December 2018). "3C459: A highly asymmetric radio galaxy with a starburst" (PDF). arxiv.org. Retrieved 19 July 2019.
- ↑ Bill Keel (October 2003). Galaxy, jet, and obscuring disk in NGC 1068. Tucson, Arizona USA: University of Arizona. Retrieved 2014-03-19.
- ↑ 64.0 64.1 Brett Hiscock (22 March 2019). "First single-beam image with the full ASKAP array". Australia Telescope National Facility. Retrieved 19 July 2019.
- ↑ 65.0 65.1 65.2 65.3 Bill Keel (October 2003). Composite emission-line spectrum of NGC 4151. Tucson, Arizona USA: University of Arizona. Retrieved 2014-03-19.
- ↑ Makarov, Dmitry; Karachentsev, Igor (21 April 2011). "Galaxy groups and clouds in the local (z∼ 0.01) Universe". Monthly Notices of the Royal Astronomical Society. 412 (4): 2498–2520. arXiv:1011.6277. Bibcode:2011MNRAS.412.2498M. doi:10.1111/j.1365-2966.2010.18071.x.
- ↑ Mahdavi, Andisheh; Trentham, Neil; Tully, R. Brent (October 2005). "The NGC 5846 Group: Dynamics and the Luminosity Function to MR = -12". The Astronomical Journal. 130 (4): 1502–1515. doi:10.1086/444560.
- ↑ "The Virgo III Groups". www.atlasoftheuniverse.com. Retrieved 9 January 2019.
- ↑ 69.0 69.1 Temi, Pasquale; Amblard, Alexandre; Gitti, Myriam; Brighenti, Fabrizio; Gaspari, Massimo; Mathews, William G.; David, Laurence (27 April 2018). "ALMA Observations of Molecular Clouds in Three Group-centered Elliptical Galaxies: NGC 5846, NGC 4636, and NGC 5044". The Astrophysical Journal. 858 (1): 17. arXiv:1711.10630. Bibcode:2018ApJ...858...17T. doi:10.3847/1538-4357/aab9b0.
- ↑ Trinchieri, G.; Goudfrooij, P. (15 May 2002). "The peculiar small-scale X-ray morphology of NGC 5846 observed with Chandra". Astronomy & Astrophysics. 386 (2): 472–486. arXiv:astro-ph/0202416. Bibcode:2002A&A...386..472T. doi:10.1051/0004-6361:20020311.
- ↑ Machacek, Marie E.; Jerius, Diab; Kraft, Ralph; Forman, William R.; Jones, Christine; Randall, Scott; Giacintucci, Simona; Sun, Ming (10 December 2011). "Deep Chandra Observations of Edges and Bubbles in the NGC 5846 Galaxy Group". The Astrophysical Journal. 743 (1): 15. arXiv:1108.5229. Bibcode:2011ApJ...743...15M. doi:10.1088/0004-637X/743/1/15.
- ↑ Brighenti, Fabrizio; Mathews, William G.; Temi, Pasquale (1 April 2015). "HOT GASEOUS ATMOSPHERES IN GALAXY GROUPS AND CLUSTERS ARE BOTH HEATED AND COOLED BY X-RAY CAVITIES". The Astrophysical Journal. 802 (2): 118. arXiv:1501.07647. Bibcode:2015ApJ...802..118B. doi:10.1088/0004-637X/802/2/118.
- ↑ 73.0 73.1 73.2 73.3 73.4 73.5 J. DePasquale and B. Whitmore (August 5, 2010). A Galactic Spectacle. Baltimore, Maryland USA: Space Telescope Science Institute. Retrieved 17 April 2019.
- ↑ 74.0 74.1 David H. Roberts, Denise C. Gabuzda, and John F. C. Wardle (1987). "Linear polarization structure of the BL Lacertae object OJ 287 at milliarcsecond resolution". The Astrophysical Journal. 323 (12): 536–42. Bibcode:1987ApJ...323..536R. doi:10.1086/165849. Unknown parameter
|month=ignored (help);|access-date=requires|url=(help) - ↑ 75.0 75.1 D. C. Gabuzda and J. F. C. Wardle and D. H. Roberts (1989). "Superluminal motion in the BL Lacertae object OJ 287". The Astrophysical Journal. 336 (1): L59–62. Bibcode:1989ApJ...336L..59G. doi:10.1086/185361. Unknown parameter
|month=ignored (help);|access-date=requires|url=(help) - ↑ 76.0 76.1 76.2 http://www.newscientist.com/article/dn18775-mysterious-radio-waves-emitted-from-nearby-galaxy.html
- ↑ Tana Joseph, Thomas Maccarone, Robert Fender: The unusual radio transient in M82: an SS 433 analogue?, 2011-07-25
- ↑ http://www.jb.man.ac.uk/news/2010/M82mystery/
- ↑ 79.0 79.1 Fachgruppe Physik (June 2, 2010). KOSMA. Köln, Deutschland: Universität zu Köln. Retrieved 2014-03-12.
- ↑ Wang Junjie (October 2010). China, Germany Build Astronomical Observatory in Tibet. People's Republic of China: Chinese Academy of Sciences. Retrieved 2014-03-12.
- ↑ 81.0 81.1 Yan Jun (October 2010). China, Germany Build Astronomical Observatory in Tibet. People's Republic of China: Chinese Academy of Sciences. Retrieved 2014-03-12.
- ↑ 82.0 82.1 David Brand (21 January 2003). Astrophysicist Robert Brown, leader in telescope development, named to head NAIC and its main facility, Arecibo Observatory. Cornell University. Retrieved 2008-09-02.
- ↑ Frederic Castel (8 May 2000). Arecibo: Celestial Eavesdropper. Space.com. Retrieved 2008-09-02.
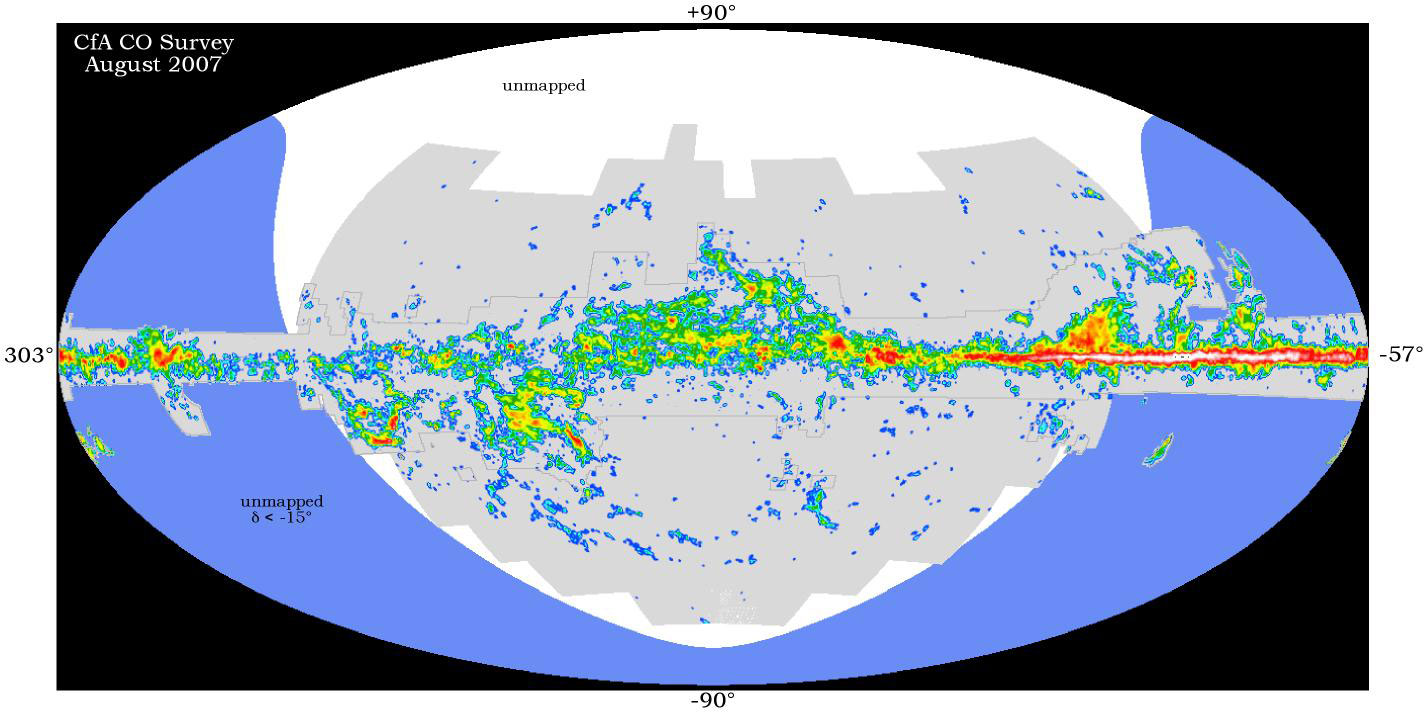
Further reading
- Uwe Arp (June 2003). Synchrotron Radiation. Gaithersburg, Maryland USA: National Institute of Standards and Technology NIST). Retrieved 2014-04-02.
External links
- Bing Advanced search
- Google Books
- Google scholar Advanced Scholar Search
- International Astronomical Union
- JSTOR
- Lycos search
- NASA/IPAC Extragalactic Database - NED
- NASA's National Space Science Data Center
- NCBI All Databases Search
- Office of Scientific & Technical Information
- Questia - The Online Library of Books and Journals
- SAGE journals online
- The SAO/NASA Astrophysics Data System
- Scirus for scientific information only advanced search
- SDSS Quick Look tool: SkyServer
- SIMBAD Astronomical Database
- SIMBAD Web interface, Harvard alternate
- Spacecraft Query at NASA
- SpringerLink
- Taylor & Francis Online
- WikiDoc The Living Textbook of Medicine
- Wiley Online Library Advanced Search
- Yahoo Advanced Web Search
Template:Physics resources{{Radiation astronomy resources}}{{Repellor vehicle}}{{Sciences resources}}Template:Sisterlinks
- CS1 maint: Multiple names: authors list
- Pages with citations using unsupported parameters
- Pages using citations with accessdate and no URL
- CS1 maint: Explicit use of et al.
- CS1 maint: Multiple names: editors list
- Pages with broken file links
- Astronomy/Lectures
- Astronomy learning projects/Lectures
- Astrophysics/Lectures
- Atmospheric science
- Lightning/Lectures
- Particle physics/Lectures
- Radiation/Lectures
- Resources last modified in October 2019