Molecule radiation astronomy
Editor-In-Chief: Henry A. hoff
"This is one of the early spectra obtained with the SPIRE fourier transform spectrometer on Herschel. Shown here is a portion of the SPIRE spectrum of VY Canis Majoris (VY CMa), a red supergiant star near the end of its life, which is ejecting huge quantities of gas and dust into interstellar space. The inset is a SPIRE camera map of VY CMa, in which it appears as a bright compact source near the edge of a large extended cloud."[1]
"The VY CMa spectrum is amazingly rich, with prominent features from carbon monoxide (CO) and water (H2O). More than 200 other spectral features have been identified so far in the full spectrum, and several unidentified features are being investigated. Many of the features are due to water, showing that the star is surrounded by large quantities of hot steam. Observations like these will help to establish a detailed picture of the mass loss from stars and the complex chemistry occurring in their extended envelopes. As in all of the SPIRE spectra, the underlying emission increases towards shorter wavelengths, and is due to the emission from dust grains. The shape of the dust spectrum provides information on the properties of the dust."[1]
"VY Canis Majoris (VY CMa) is a red supergiant star located about 4900 light years from Earth in the constellation Canis Major. It is the largest known star, with a size of 2600 solar radii, and also one of the most luminous, with a luminosity in excess of 100 000 times that of the Sun. The mass of VY CMa lies in the range 30-40 solar masses, and it has a mass-loss rate of 2 x 10⁻⁴ solar masses per year."[1]
"The shell of gas it has ejected displays a complex structure; the circumstellar envelope is among the most remarkable chemical laboratories known in the Universe, creating a rich set of organic and inorganic molecules and dust species. Through stellar winds, these inorganic and organic compounds are injected into the interstellar medium, from which new stars orbited by new planets may form. Most of the carbon supporting life on Earth was forged by this kind of evolved star. VY CMa truly is a spectacular object, it is close to the end of its life and could explode as a supernova at any time."[1]
Torbernites
Torbernite is a radioactive, hydrated green copper uranyl phosphate mineral, found in granites and other uranium-bearing deposits as a secondary mineral. Torbernite is isostructural with the related uranium mineral, autunite. The chemical formula of torbenite is similar to that of autunite in which a Cu2+ cation replaces a Ca2+. The number of water hydration molecules can vary between 12 and 8, giving rise to the variety of metatorbernite when torbernite spontaneously dehydrates.
Bands
At the right is Saturn imaged by the Stockholm Infrared Camera (SIRCA) in the H2O infrared band to show the presence of water vapor. The image is cut off near the top due to the presence of Saturn's rings.
Backgrounds
"The light blue background is the dayglow emission (less than 1 kR) caused by the interaction between the photoelectrons generated by solar UV radiation and atmospheric molecules and atoms."[2] This background occurs when imaging an Earth aurora from space using ultraviolet astronomy at the VUV wavelengths (135.6 ± 1.5 nm and 149.3 ± 1.5 nm).
"Isophotes of [blue (395.0-485.0 nm)] background starlight brightness (integrated starlight, diffuse galactic light, cosmic light) have been constructed near the celestial [NCP and SCP], ecliptic [NEP and SEP], and galactic [NGP and SGP] poles from observations accumulated by the Pioneer 10 [and 11] imaging photopolarimeter from beyond the asteroid belt."[3]
"Diffuse galactic [blue] light refers to starlight scattered by interstellar grains. Integrated light from extragalactic sources is referred to as cosmic light."[3]
"Earth-based observers are limited in their perception of background starlight, due to the presence of airglow line and continuum emission, zodiacal light, and the effects of atmospheric extinction and scattering."[3]
Some of the blue background data were collected on September 30, 1973 (day/year 279/73).[3]
"To determine the brightnesses, isophotes were generated from six days of merged data, chosen to optimize sky coverage. The days used and their heliocentric distances in AU are: 354/72 (3.27), 149/73 (4.23), 237/73 (4.64), 279/73 (4.81), 21/74 (5.08), 68/74 (5.15)."[3]
Conversion of units over the Pioneer blue (B) bandpass is[3]
- <math> 1S_{10}(V)_B = 1.16 x 10^{-8} erg cm^{-2} s^{-1} sr^{-1} nm^{-1}. </math>
For example,
NCP <math> S_{10}(V)_B = 56, </math> NEP <math> S_{10}(V)_B = 66, </math> and NGP <math> S_{10}(V)_B = 31. </math>[3]
Whereas,
SCP <math> S_{10}(V)_B = 74, </math> SEP <math> S_{10}(V)_B = 128, </math> and SGP <math> S_{10}(V)_B = 26. </math>[3]
Violets
"The abundance ratios of stable isotopes of the light elements in comets may provide clues of cosmogonical significance."[4]
"In 1997 we observed comet Hale-Bopp with the 2.6 m Nordic Optical Telescope on La Palma, Canary Islands, with a view to estimating the 12C/13C abundance ratio. About twenty high-resolution (λ /Δ λ ~ 70000) spectra of the strong CN Violet (0,0) band were secured with the SOFIN spectrograph from 7 to 13 April. The heliocentric and geocentric distances of the comet were then close to 0.9 AU and 1.4 AU, respectively. While the data do show the expected lines of the 13C14N isotopic molecule, we have been surprised to find in addition a number of very weak features, which are real and turn out to be positioned very near to the theoretical wavelengths of lines pertaining to the R branch of 12C15N."[4]
Blues
"The light blue background is the dayglow emission (less than 1 kR) caused by the interaction between the photoelectrons generated by solar UV radiation and atmospheric molecules and atoms."[2] This background occurs when imaging an Earth aurora from space using ultraviolet astronomy at the VUV wavelengths (135.6 ± 1.5 nm and 149.3 ± 1.5 nm).
Submillimeters
Submillimetre astronomy or submillimeter astronomy is the branch of observational astronomy that is conducted at submillimetre wavelengths of the electromagnetic spectrum. Astronomers place the submillimetre waveband between the far-infrared and microwave wavebands, typically taken to be between a few hundred micrometres and a millimetre." and "Using submillimetre observations, astronomers examine molecular clouds and dark cloud cores with a goal of clarifying the process of star formation from earliest collapse to stellar birth.
These wavelengths are sometimes called Terahertz radiation, since they have frequencies of the order of 1 THz.
"The Antennae Galaxies (also known as NGC 4038 and 4039) are a pair of distorted colliding spiral galaxies about 70 million light-years away, in the constellation of Corvus (The Crow). This view combines ALMA observations, made in two different wavelength ranges during the observatory’s early testing phase, with visible-light observations from the NASA/ESA Hubble Space Telescope."[5]
"The Hubble image is the sharpest view of this object ever taken and serves as the ultimate benchmark in terms of resolution. ALMA observes at much longer wavelengths which makes it much harder to obtain comparably sharp images. However, when the full ALMA array is completed its vision will be up to ten times sharper than Hubble."[5]
"[T]he detection of absorption by interstellar hydrogen fluoride (HF) [in the submillimeter band occurs] along the sight line to the submillimeter continuum sources W49N and W51."[6]
"HF is the dominant reservoir of fluorine wherever the interstellar H2/atomic H ratio exceeds ~ 1; the unusual behavior of fluorine is explained by its unique thermochemistry, F being the only atom in the periodic table that can react exothermically with H2 to form a hydride."[6]
The observations "toward W49N and W51 [occurred] on 2010 March 22 ... The observations were carried out at three different local oscillator (LO) tunings in order to securely identify the HF line toward both sight lines. The dual beam switch mode (DBS) was used with a reference position located 3' on either side of the source position along an East-West axis. We centered the telescope beam at α =19h10m13.2s, δ = 09°06'12.0" for W49N and α = 19h23m43.9s, δ = 14°30'30.5" for W51 (J2000.0). The total on-source integration time amounts to 222s on each source using the Wide Band Spectrometer (WBS) that offers a spectral resolution of 1.1 MHz (~0.3 km s-1 at 1232 GHz)."[6]
"[T]he first detection of chloronium, H2Cl+, in the interstellar medium, [occurred on March 1 and March 23, 2010,] using the HIFI instrument aboard the Herschel Space Observatory. The 212 − 101 lines of ortho-H235Cl+ and ortho-H237Cl+ are detected in absorption towards NGC 6334I, and the 111 − 000 transition of para-H235Cl+ is detected in absorption towards NGC 6334I and Sgr B2(S)."[7]
"The [microwave] detection of interstellar formaldehyde provides important information about the chemical physics of our galaxy. We now know that polyatomic molecules containing at least two atoms other than hydrogen can form in the interstellar medium."[8] "H2CO is the first organic polyatomic molecule ever detected in the interstellar medium".[8]
Radios
CO is such a common interstellar molecule that it is used to map out molecular regions.[9] The radio observation of perhaps greatest human interest is the claim of interstellar glycine,[10] the simplest amino acid, but with considerable accompanying controversy.[11]
Atmospheres
"If we know beforehand that a nebula is not of the emission type, observations of its polarization enable us to go a step farther. In general, if a particle scatters light in such a way that it does not hold the energy for any length of time but simply defects it without change of wave-length, then the polarization of the deflected light has the following characteristics: (a) its plane of polarization is usually perpendicular to or, more rarely, parallel to the plane formed by the incident and the scattered rays; and (b) the amount of polarization is inversely correlated with the size of the particles. When the scattering particles are of the order of size of a few hundred molecules or smaller we have what is usually known as Rayleigh scattering. Here the polarization reaches very large values, as is evidenced by our own blue atmosphere, which gives values up to 70 per cent."[12]
Compounds
"Baby stars are forming near the eastern rim of the cosmic cloud Perseus, in this infrared image from NASA's Spitzer Space Telescope."[13]
"The baby stars are approximately three million years old and are shown as reddish-pink dots to the right of the image. The pinkish color indicates that these infant stars are still shrouded by the cosmic dust and gas that collapsed to form them. These stars are part of the IC348 star cluster, which consists of over 300 known member stars."[13]
"The Perseus Nebula can be seen as the large green cloud at the center of the image. Wisps of green are organic molecules called Polycyclic Aromatic Hydrocarbons (PAHs) that have been illuminated by the nearby star formation. Meanwhile, wisps of orange-red are dust particles warmed by the newly forming stars. The Perseus Nebula is located about 1,043 light-years away in the Perseus constellation."[13]
"The image is a three channel false color composite, where emission at 4.5 microns is blue, emission at 8.0 microns is green, and 24-micron emission is red."[13]
Molecular clouds
G0.253+0.016 was probed "with another network of telescopes, the Combined Array for Research in Millimeter-wave Astronomy [CARMA] in California."[14]
"G0.253+0.016, which is about 30 light-years long, defies the conventional wisdom that dense gas glouds should produce lots of stars. ... The cloud is 25 times more dense than the famous Orion Nebula, which is birthing stars at a furious rate. But only a few stars are being born in G0.253+0.016, and they're pretty much all runts."[14]
"It's a very dense cloud and it doesn't form any massive stars, which is very weird"[14].
"CARMA data showed that gas within G0.253+0.016 is zipping around 10 times faster than gas in similar clouds. G0.253+0.016 is on the verge of flying apart, with its gas churning too violently to coalesce into stars. Further, the ... cloud is full of silicon monoxide, a compound typically produced when fast-moving gas smashes into dust particles. The abnormally large amounts of silicon monoxide suggest that G0.253+0.016 may actually consist of two colliding clouds, whose impact is generating powerful shockwaves."[14]
When surveyed at 1.1 mm as part of the Bolocam Galactic Plane Survey, "[t]he only currently known starless [massive proto-cluster] MPC is G0.253+0.016, which lies within the dense central molecular zone and is subject to greater environmental stresses than similar objects in the Galactic plane (Longmore et al. 2012)."[15]
Def. a "large and relatively dense cloud of cold gas and dust in interstellar space from which new stars are formed"[16] is called a molecular cloud.
The image on the right is a composite of visible (B 440 nm and V 557 nm) and near-infrared (768 nm) of the dark cloud (absorption cloud) Barnard 68.[17]
Barnard 68 is around 500 lyrs away in the constellation Ophiuchus.[17]
"At these wavelengths, the small cloud is completely opaque because of the obscuring effect of dust particles in its interior."[17]
"It was obtained with the 8.2-m VLT ANTU telescope and the multimode FORS1 instrument in March 1999."[17]
In the image second down at right is a molecular cloud of gas and dust that is being reduced. "Likely, within a few million years, the intense light from bright stars will have boiled it away completely. The cloud has broken off of part of the Carina Nebula, a star forming region about 8000 light years away. Newly formed stars are visible nearby, their images reddened by blue light being preferentially scattered by the pervasive dust. This image spans about two light years and was taken by the orbiting Hubble Space Telescope in 1999."[18]
A molecular cloud, sometimes called a stellar nursery if star formation is occurring within, is a type of interstellar cloud whose density and size permits the formation of molecules, most commonly molecular hydrogen (H2).
Molecular hydrogen is difficult to detect by infrared and radio observations, so the molecule most often used to determine the presence of H2 is CO (carbon monoxide). The ratio between CO luminosity and H2 mass is thought to be constant, although there are reasons to doubt this assumption in observations of some other galaxies.[19]
Such clouds make up < 1% of the ISM, have temperatures of 10-20 K and high densities of 102 - 106 atoms/cm3. These clouds are astronomical radio and infrared sources with radio and infrared molecular emission and absorption lines.
Giant molecular clouds
A vast assemblage of molecular gas with a mass of approximately 103–107 times the mass of the Sun[20] is called a giant molecular cloud (GMC). GMCs are ≈15–600 light-years in diameter (5–200 parsecs).[20] Whereas the average density in the solar vicinity is one particle per cubic centimetre, the average density of a GMC is 102–103 particles per cubic centimetre. Although the Sun is much denser than a GMC, the volume of a GMC is so great that it contains much more mass than the Sun. The substructure of a GMC is a complex pattern of filaments, sheets, bubbles, and irregular clumps.[21]
The densest parts of the filaments and clumps are called "molecular cores", whilst the densest molecular cores are, unsurprisingly, called "dense molecular cores" and have densities in excess of 104–106 particles per cubic centimeter. Observationally molecular cores are traced with carbon monoxide and dense cores are traced with ammonia. The concentration of dust within molecular cores is normally sufficient to block light from background stars so that they appear in silhouette as dark nebulae.[22]
GMCs are so large that "local" ones can cover a significant fraction of a constellation; thus they are often referred to by the name of that constellation, e.g. the Orion Molecular Cloud (OMC) or the Taurus Molecular Cloud (TMC). These local GMCs are arrayed in a ring in the neighborhood of the Sun coinciding with the Gould Belt.[23] The most massive collection of molecular clouds in the galaxy forms an asymmetrical ring around the galactic center at a radius of 120 parsecs; the largest component of this ring is the Sagittarius B2 complex. The Sagittarius region is chemically rich and is often used as an exemplar by astronomers searching for new molecules in interstellar space.[24]
Astrophysics
Def. a cavity filled with hot gas blown into the interstellar medium by stellar winds is called an astrosphere.
Def. the study of interstellar atoms and molecules and their interaction with radiation [is] called molecular astrophysics.
Venus
In visual astronomy almost no variation or detail can be seen in the clouds. The surface is obscured by a thick blanket of clouds. Venus is shrouded by an opaque layer of highly reflective clouds of sulfuric acid, preventing its surface from being seen from space in visible light. It has thick clouds of sulfur dioxide. There are lower and middle cloud layers. The thick clouds consisting mainly of sulfur dioxide and sulfuric acid droplets.[25][26] These clouds reflect and scatter about 90% of the sunlight that falls on them back into space, and prevent visual observation of the Venusian surface. The permanent cloud cover means that although Venus is closer than Earth to the Sun, the Venusian surface is not as well lit.
Strong 300 km/h winds at the cloud tops circle the planet about every four to five earth days.[27] Venusian winds move at up to 60 times the speed of the planet's rotation, while Earth's fastest winds are only 10% to 20% rotation speed.[28]
Earth
"Energetic neutral atoms (ENA), emitted from the magnetosphere with energies of ∼50 keV, have been measured with solid-state detectors on the IMP 7/8 and ISEE 1 spacecraft. The ENA are produced when singly charged trapped ions collide with the exospheric neutral hydrogen geocorona and the energetic ions are neutralized by charge exchange."[29]
"The IMAGE mission ... High Energy Neutral Atom imager (HENA) ... images [ENAs] at energies between 10 and 60 keV/nucleon [to] reveal the distribution and the evolution of energetic [ions, including protons] as they are injected into the ring current during geomagnetic storms, drift about the Earth on both open and closed drift paths, and decay through charge exchange to pre‐storm levels."[30]
Airglows
In the International Space Station image at right, you can "see green and yellow airglow paralleling the Earth’s horizon line (or limb) before it is overwhelmed by the light of the rising Sun. Airglow is the emission of light by atoms and molecules in the upper atmosphere after they are excited by ultraviolet radiation. ... Astronaut photograph ISS030-E-015491 was acquired on December 22, 2011, with a Nikon digital camera, and is provided by the ISS Crew Earth Observations experiment and Image Science & Analysis Laboratory, Johnson Space Center."[31]
Airglow (also called nightglow) is the very weak emission of light by a planetary atmosphere. In the case of Earth's atmosphere, this optical phenomenon causes the night sky to never be completely dark (even after the effects of starlight and diffused sunlight from the far side are removed).
Airglow is caused by various processes in the upper atmosphere, such as the recombination of ions which were photoionized by the sun during the day, luminescence caused by cosmic rays striking the upper atmosphere, and chemiluminescence caused mainly by oxygen and nitrogen reacting with hydroxyl ions at heights of a few hundred kilometers. It is not noticeable during the daytime because of the scattered light from the Sun.
Auroras
.jpg)
"When the charged particles from the Sun penetrate Earth's magnetic shield, they are channelled downwards along the magnetic field lines until they strike atoms of gas high in the atmosphere. Like a giant fluorescent neon lamp, the interaction with excited oxygen atoms generates a green or, more rarely, red glow in the night sky, while excited nitrogen atoms yield blue and purple colours."[32]
"Pulsating auroras are so-called because their features shift and brighten in distinct patches, rather than elongated arcs across the sky like active auroras. However, their appearance isn't the only difference. Though all auroras are caused by energetic particles--typically electrons--speeding down into Earth's atmosphere and colliding brilliantly with the atoms and molecules in the air, the source of these electrons is different for pulsating auroras and active auroras."[33]
The "density of neutral atoms within the atmosphere can change throughout the day because of heating by sunlight, the original understanding was that the heating—and the extra-dense layers of neutral particles—was driven horizontally. However, some satellites have hit speed bumps as they have orbited through Earth’s magnetic cusp—their acceleration briefly slowed, which indicates a small vertical slice of higher-density neutral atoms that are harder to travel through."[34]
"Auroras are produced by solar storms that eject clouds of energetic charged particles. These particles are deflected when they encounter the Earth’s magnetic field, but in the process large electric voltages are created. Electrons trapped in the Earth’s magnetic field are accelerated by these voltages and spiral along the magnetic field into the polar regions. There they collide with atoms high in the atmosphere and emit X-rays".[35]
"Auroras are known to be generated by beams of electrons which are accelerated along Earth's magnetic field lines. The fast-moving electrons collide with atoms in the ionosphere at altitudes of between 100 to 600 km. This interaction with oxygen atoms results in a green or, more rarely, red glow in the night sky, while nitrogen atoms yield blue and purple colours."[36]
- "Type A aurora (green with red tops):
1. colors due to emission by atomic oxygen
- Type D aurora (red):
2. red color due to emission by atomic oxygen (as in Type A)
- Proton aurora:
3. additional red and blue from atomic hydrogen emission"[37]
"This view [on the left] of the Aurora Australis, or Southern Lights, which was photographed by an astronaut aboard Space Shuttle Discovery (STS-39) in 1991, shows a spiked band of red and green aurora above the Earth's Limb. Calculated to be at altitudes ranging from 80 - 120 km (approx. 50-80 miles), the auroral light shown is due to the "excitation" of atomic oxygen in the upper atmosphere by charged particles (electrons) streaming down from the magnetosphere above."[38]
Mars
"The major atmospheric gases on Earth, Venus, and Mars were probably CO2, H2O, and N2. [The ions from the upper parts of an atmosphere] are often suprathermal, and their interactions can produce suprathermal neutral atoms as well [The] ionopause [...] separates the bound ionosphere from an outer region in which the solar wind is diverted and flows around and past the planet. This region still contains some neutral gas, and if such atoms are ionized by solar photons or electron impact, they are swept up in the flow."[39]
"There are strong reasons to believe that Mars once had much more atmospheric CO2 and H2O than it now has ... (Impacts, which may have eroded even larger amounts, operated at an earlier period.) ... The visible polar caps are thought to contain relatively small quantities. [...] More recently it has been proposed (35) that Mars may have had several episodes of high atmospheric pressure, warm conditions, and substantial precipitation of rain and snow, with a north polar ocean and southern glaciers."[39]
Methane is found in the Martian atmosphere, first image at right, by carefully observing the planet throughout several Mars years with NASA's Infrared Telescope Facility and the W.M. Keck telescope, both at Mauna Kea, Hawaii.
At right is an X-ray image of Mars. X-radiation from the Sun excites oxygen atoms in the Martian upper atmosphere, about 120 km above its surface, to emit X-ray fluorescence. A faint X-ray halo that extends out to 7,000 km above the surface of Mars has also been found.[40]
Callisto
At right is a complete global color image of Callisto. Bright scars on a darker surface testify to a long history of impacts on Jupiter's moon Callisto. The picture, taken in May 2001, is the only complete global color image of Callisto obtained by Galileo, which has been orbiting Jupiter since December 1995. Of Jupiter's four largest moons, Callisto orbits farthest from the giant planet. Callisto's surface is uniformly cratered but is not uniform in color or brightness. Scientists believe the brighter areas are mainly ice and the darker areas are highly eroded, ice-poor material.
Callisto's ionosphere was first detected during Galileo flybys;[41] its high electron density of 7–17 x 104 cm−3 cannot be explained by the photoionization of the atmospheric carbon dioxide alone.
Jupiter
"Spectra from the Voyager I IRIS experiment confirm the existence of enhanced infrared emission near Jupiter's north magnetic pole in March 1979."[42] "Some species previously detected on Jupiter, including CH3D, C2H2, and C2H6, have been observed again near the pole. Newly discovered species, not previously observed on Jupiter, include C2H4, C3H4, and C6H6. All of these species except CH3D appear to have enhanced abundances at the north polar region with respect to midlatitudes."[42]
"These images [at right] show the distribution of the organic molecule acetylene at the north and south poles of Jupiter, based on data obtained by NASA's Cassini spacecraft in early January 2001. It is the highest-resolution map of acetylene to date on Jupiter. The enhanced emission results both from the warmer temperatures in the auroral hot spots, and probably also from an enhanced abundance in these regions. The detection helps scientists understand the chemical interactions between sunlight and molecules in Jupiter's stratosphere."[43]
Europa
Europa has a tenuous atmosphere composed primarily of oxygen.
Observations with the Goddard High Resolution Spectrograph of the Hubble Space Telescope, first described in 1995, revealed that Europa has a tenuous atmosphere composed mostly of molecular oxygen (O2).[44][45] The surface pressure of Europa's atmosphere is 0.1 μPa, or 10−12 times that of the Earth.[46] In 1997, the Galileo spacecraft confirmed the presence of a tenuous ionosphere (an upper-atmospheric layer of charged particles) around Europa created by solar radiation and energetic particles from Jupiter's magnetosphere,[47][48] providing evidence of an atmosphere.
The molecular hydrogen that escapes Europa's gravity, along with atomic and molecular oxygen, forms a torus (ring) of gas in the vicinity of Europa's orbit around Jupiter. This "neutral cloud" has been detected by both the Cassini and Galileo spacecraft, and has a greater content (number of atoms and molecules) than the neutral cloud surrounding Jupiter's inner moon Io. Models predict that almost every atom or molecule in Europa's torus is eventually ionized, thus providing a source to Jupiter's magnetospheric plasma.[49]
Io
"The camera on Cassini captured images of eclipsed Io in several colors ranging from the near-ultraviolet to the near-infrared. A black-and-white movie clip of 48 clear-filter frames spanning two hours during the eclipse was released on February 5 (PIA02882). Here, two colors have been added to show the type of evidence used by imaging scientists in determining the source of Io's auroral glows. The color pictures were taken at lower resolution -- 120 kilometers (75 miles) per pixel rather than 60 kilometers(37 miles) per pixel -- and less frequently than the clear-filter images. White dots near the equator are volcanoes, some of which are much brighter than the faint atmospheric glows. The brightest of them is the volcano Pele."[50]
"Emissions of light (at wavelengths of 595 to 645 nanometers) likely arise from a tenuous atmosphere of oxygen. These glows would appear red to the eye and are consequently colored red in the movie. Emissions in near-ultraviolet wavelengths (between 300 and 380 nanometers), corresponding wavelength to the bright blue visible glows one would expect from sulfur dioxide. They have been colored blue in the movie. The blue glows are restricted to areas deep down in the atmosphere near the surface of Io, while the red glows are much more extensive, reaching heights of up to 900 kilometers (560 miles). This would be expected if the blue glows are indeed produced by sulfur dioxide, since sulfur dioxide molecules are heavier than oxygen atoms, so are more closely bound to the surface by gravity. The prominent blue and red regions near the equator of Io dance across the moon with the changing orientation of Jupiter's magnetic field, illustrating the relationship between Io's auroras and the electric currents that excite them."[50]
"A faint blue emission is visible near the north pole of Io, possibly due to a volcanic plume erupting from the volcano Tvashtar at high northern latitude on the side of Io opposite Cassini. This eruption, observed by both Galileo and Cassini, left an enormous red ring around Tvashtar, visible in image PIA02588, released on March 29, 2001."[50]
Saturn
"The view [at right] from Hubble [of Saturn], taken on March 22, 2004, is so sharp that many individual Saturnian ringlets can be seen."[51]
"Hubble's exquisite optics, coupled with the high resolution of its Advanced Camera for Surveys, allow it to take pictures of Saturn which are nearly as sharp as Cassini's, even though Hubble is nearly a billion miles farther from Saturn than Cassini."[51]
"Camera exposures in four filters (blue, blue-green, green, and red) were combined to form the Hubble image, to render colors similar to what the eye would see through a telescope focused on Saturn. The subtle pastel colors of ammonia-methane clouds trace a variety of atmospheric dynamics. Saturn displays its familiar banded structure, and haze and clouds of various altitudes. Like Jupiter, all bands are parallel to Saturn's equator. Even the magnificent rings, at nearly their maximum tilt toward Earth, show subtle hues, which indicate the trace chemical differences in their icy composition."[51]
Titan
"As spring continues to unfold at Saturn, April showers on the planet's largest moon, Titan, have brought methane rain to its equatorial deserts ... Extensive rain from large cloud systems ... has apparently darkened the surface of the moon."[52]
“It's amazing to be watching such familiar activity as rainstorms and seasonal changes in weather patterns on a distant, icy satellite".[53]
"Clouds on Titan are formed of methane as part of an Earth-like cycle that uses methane instead of water. On Titan, methane fills lakes on the surface, saturates clouds in the atmosphere, and falls as rain. Though there is evidence that liquids have flowed on the surface at Titan's equator in the past, liquid hydrocarbons, such as methane and ethane, had only been observed on the surface in lakes at polar latitudes. The vast expanses of dunes that dominate Titan's equatorial regions require a predominantly arid climate."[52]
"An arrow-shaped storm appeared in the equatorial regions on Sept. 27, 2010 -- the equivalent of early April in Titan's “year” -- and a broad band of clouds appeared the next month. ... A 193,000-square-mile (500,000-square-kilometer) region along the southern boundary of Titan’s Belet dune field, as well as smaller areas nearby, had become darker. ... this change in brightness is most likely the result of surface wetting by methane rain."[52]
“These outbreaks may be the Titan equivalent of what creates Earth's tropical rainforest climates, even though the delayed reaction to the change of seasons and the apparently sudden shift is more reminiscent of Earth's behavior over the tropical oceans than over tropical land areas”.[54]
At right is an image that shows clouds over the equatorial region of Titan.
"Methane clouds in the troposphere, the lowest part of the atmosphere, appear white here and are mostly near Titan's equator. The darkest areas are surface features that have a low albedo, meaning they do not reflect much light. Cassini observations of clouds like these provide evidence of a seasonal shift of Titan's weather systems to low latitudes following the August 2009 equinox in the Saturnian system. (During equinox, the sun lies directly over the equator. See PIA11667 to learn how the sun's illumination of the Saturnian system changed during the equinox transition to spring in the northern hemispheres and to fall in the southern hemispheres of the planet and its moons.)"[55]
"In 2004, during Titan's late southern summer, extensive cloud systems were common in Titan's south polar region (see PIA06110, PIA06124 and PIA06241). Since 2005, southern polar systems have been observed infrequently, and one year after the equinox, extensive near-equatorial clouds have been seen. This image was taken on Oct. 18, 2010, a little more than one Earth year after the Saturnian equinox, which happens once in roughly 15 Earth years."[55]
"The cloud patterns observed from late southern summer to early southern fall on Titan suggest that Titan's global atmospheric circulation is influenced by both the atmosphere and the surface. The temperature of the surface responds more rapidly to changes in illumination than does the thick atmosphere. Outbreaks such as the clouds seen here may be the Titan equivalent of what creates the Earth's tropical rainforest climates, even though the delayed reaction to the change of seasons and the apparently sudden shift is more reminiscent of the behavior over Earth's tropical oceans than over tropical land areas."[55]
The climate—including wind and rain—creates surface features similar to those of Earth, such as sand dunes, rivers, lakes and seas (probably of liquid methane and ethane), and deltas, and is dominated by seasonal weather patterns as on Earth. With its liquids (both surface and subsurface) and robust nitrogen atmosphere, Titan's methane cycle is viewed as an analog to Earth's water cycle, although at a much lower temperature.
"These mosaics [at second right] of the south pole of Saturn's moon Titan, made from images taken almost one year apart, show changes in dark areas that may be lakes filled by seasonal rains of liquid hydrocarbons."[56]
"The images on the left (unlabeled at top and labeled at bottom) were acquired July 3, 2004. Those on the right were taken June 6, 2005. In the 2005 images, new dark areas are visible and have been circled in the labeled version. The very bright features are clouds in the lower atmosphere (the troposphere). Titan's clouds behave similarly to those on Earth, changing rapidly on timescales of hours and appearing in different places from day to day. During the year that elapsed between these two observations, clouds were frequently observed at Titan's south pole by observers on Earth and by Cassini's imaging science subsystem (see PIA06124)."[56]
"It is likely that rain from a large storm created the new dark areas that were observed in June 2005. Some features, such as Ontario Lacus, show differences in brightness between the two observations that are the result of differences in illumination between the two observations. These mosaics use images taken in infrared light at a wavelength of 938 nanometers. The images have been oriented with the south pole in the center (black cross) and the 0 degree meridian toward the top. Image resolutions are several kilometers (several miles) per pixel."[56]
"Evidence from Cassini's imaging science subsystem, radar, and visual and infrared mapping spectrometer instruments strongly suggests that dark areas near the poles are lakes of liquid hydrocarbons-an analysis affirmed by images capturing those changes in the lakes thought to be brought on by rainfall."[57]
Uranus
Uranus has a complex, layered cloud structure, with methane thought to make up the uppermost layer of clouds.[58] With a large telescope of 25 cm or wider, cloud patterns may be visible.[59] When Voyager 2 flew by Uranus in 1986, it observed a total of ten cloud features across the entire planet.[60][61] Besides the large-scale banded structure, Voyager 2 observed ten small bright clouds, most lying several degrees to the north from the collar.[60]
In the 1990s, the number of the observed bright cloud features grew considerably partly because new high resolution imaging techniques became available.[62] Most were found in the northern hemisphere as it started to become visible.[62] An early explanation - that bright clouds are easier to identify in the dark part of the planet, whereas in the southern hemisphere the bright collar masks them - was shown to be incorrect: the actual number of features has indeed increased considerably.[63][64] Nevertheless there are differences between the clouds of each hemisphere. The northern clouds are smaller, sharper and brighter.[64] They appear to lie at a higher altitude.[64] The lifetime of clouds spans several orders of magnitude. Some small clouds live for hours, while at least one southern cloud may have persisted since Voyager flyby.[62][61] Recent observation also discovered that cloud features on Uranus have a lot in common with those on Neptune.[62] For example, the dark spots common on Neptune had never been observed on Uranus before 2006, when the first such feature dubbed Uranus Dark Spot was imaged.[65] The speculation is that Uranus is becoming more Neptune-like during its equinoctial season.[66]
For a short period from March to May 2004, a number of large clouds appeared in the Uranian atmosphere, giving it a Neptune-like appearance.[64][67]
On August 23, 2006, researchers at the Space Science Institute (Boulder, CO) and the University of Wisconsin observed a dark spot on Uranus's surface, giving astronomers more insight into the planet's atmospheric activity.[65]
The bright collar at −45° latitude is also connected with methane clouds.[68] Other changes in the southern polar region can be explained by changes in the lower cloud layers.[68]
The wind speeds on Uranus can reach 250 meters per second (900 km/h, 560 mph).[62] The tracking of numerous cloud features allowed determination of zonal winds blowing in the upper troposphere of Uranus.[62] At the equator winds are retrograde, which means that they blow in the reverse direction to the planetary rotation. Their speeds are from −100 to −50 m/s.[62][69] Wind speeds increase with the distance from the equator, reaching zero values near ±20° latitude, where the troposphere's temperature minimum is located.[62][70] Closer to the poles, the winds shift to a prograde direction, flowing with the planet's rotation. Windspeeds continue to increase reaching maxima at ±60° latitude before falling to zero at the poles.[62] Windspeeds at −40° latitude range from 150 to 200 m/s. Since the collar obscures all clouds below that parallel, speeds between it and the southern pole are impossible to measure.[62] In contrast, in the northern hemisphere maximum speeds as high as 240 m/s are observed near +50 degrees of latitude.[62][69][71] ... Observations included record-breaking wind speeds of 229 m/s (824 km/h) and a persistent thunderstorm referred to as "Fourth of July fireworks".[61]
Neptune
A trace amount of methane is also present. Prominent absorption bands of methane occur at wavelengths above 600 nm, in the red and infrared portion of the spectrum. As with Uranus, this absorption of red light by the atmospheric methane is part of what gives Neptune its blue hue,[72] although Neptune's vivid azure differs from Uranus's milder cyan. Since Neptune's atmospheric methane content is similar to that of Uranus, some unknown atmospheric constituent is thought to contribute to Neptune's colour.[73]
Protoplanetary disks
"Seven papers in [the journal] Science [...] (December 2006) discuss details of the sample analysis. Among their findings are discoveries of a wide range of organic compounds, including two that contain biologically usable nitrogen. Indigenous aliphatic hydrocarbons were found with longer chain lengths than those observed in the diffuse interstellar medium. The Stardust samples contain abundant amorphous silicates in addition to crystalline silicates such as olivine and pyroxene. The presence of crystalline silicates in Wild 2 is consistent with mixing of solar system and interstellar matter, something which had been deduced spectroscopically before (see quote above). No hydrous silicates or carbonate minerals were detected, which suggests a lack of aqueous processing of Wild 2 dust. Very few pure carbon (CHON) particles were found in the samples returned."[74]
Hills clouds
The Hills cloud (also called the inner Oort cloud and inner cloud[75]) is a vast theoretical circumstellar disc, interior to the Oort cloud, whose outer border would be located at around 20,000 to 30,000 AU from the Sun, and whose inner border, less well-defined, is hypothetically located at 250-1500 AU, well beyond planetary and Kuiper Belt object orbits - but distances might be much greater. If it exists, the Hills cloud contains roughly 5 times as many comets as the Oort cloud.[76]
Objects ejected from the Hills cloud are likely to end up in the classical Oort cloud region, maintaining the Oort cloud.[77]
The existence of the Hills cloud is plausible, since many bodies have been found already. It would be denser than the Oort cloud.[78][79]
Comets may be rooted in a cloud orbiting the outer boundary of the Solar System.[80]
Comets are usually destroyed after several passes through the inner Solar System, so if any had existed for several billion years (since the beginning of the Solar System), no more could be observed now.[81] The distribution of the inverse of the semi-major axes showed a maximum frequency which suggested the existence of a reservoir of comets between 40,000 (Expression error: Unexpected round operator. ) away.[81] This reservoir, located at the limits of the Sun's sphere of astrodynamic influence, would be subject to stellar disturbances, likely to expel cloud comets outwards or inwards.[81]
Most estimates place the population of the Hills cloud at about 20 trillion (about five to ten times that of the outer cloud), although the number could be ten times greater than that.[82] The orbits of most cloud comets have a semi-major axis of 10,000 AU, much closer to the Sun than the proposed distance of the Oort cloud.[78] Moreover, the influence of the surrounding stars and that of the galactic tide should have sent the Oort cloud comets either closer to the Sun or outside of the Solar System. The presence of an inner cloud, which would have tens or hundreds of times as many cometary nuclei as the outer halo was proposed.[78]
The majority of comets in the Solar System were located not in the Oort cloud area, but closer and in an internal cloud, with an orbit with a semi-major axis of 5,000 AU.[83]
It is likely that the Hills cloud is the largest concentration of comets across the Solar System.[84] The Hills cloud is much denser than the outer Oort cloud; it is somewhere between 5,000 and 20,000 AU in size. In contrast, the Oort cloud is between 20,000 (Expression error: Unexpected round operator. ) in size.[85]
The mass of the Hills cloud may be five times more massive than the Oort cloud.[86] Or, the mass of the Hills cloud to be 13.8 Earth masses, if the majority of the bodies are located at 10,000 AU.[83]
The vast majority of Hills cloud objects consists of various ices, such as water, methane, ethane, carbon monoxide and hydrogen cyanide.[87] However, the discovery of the object 1996 PW, an asteroid on a typical orbit of a long-period comet, suggests that the cloud may also contain rocky objects.[88]
The carbon analysis and isotopic ratios of nitrogen firstly in the comets of the families of the Oort cloud and the other in the body of the Jupiter area shows little difference between the two, despite their distinctly remote areas, which suggests that both come from a protoplanetary disk,[89] a conclusion also supported by studies of comet cloud sizes and the recent impact study of Comet Tempel 1.[90]
The Oort cloud or the Öpik–Oort cloud[92] is a hypothesized spherical cloud of comets which may lie roughly 50,000 AU, or nearly a light-year, from the Sun.[93] This places the cloud at nearly a quarter of the distance to Proxima Centauri, the nearest star to the Sun. The outer limit of the Oort cloud defines the cosmographical boundary of the Solar System and the region of the Sun's gravitational dominance.[94]
The Oort cloud is divided into two regions: a circumstellar disc-shaped inner Oort cloud (or Hills cloud) and a circumstellar envelope, spherical outer Oort cloud. Both regions lie beyond the heliosphere and in interstellar space.[95][96]
Voyager 1, the fastest[97] and farthest[98][99] of the interplanetary space probes currently leaving the Solar System, will reach the Oort cloud in about 300 years[96][100] and would take about 30,000 years to pass through it.[101][102] However, around 2025, the radioisotope thermoelectric generators on Voyager 1 will no longer supply enough power to operate any of its scientific instruments, preventing any further exploration by Voyager 1.
Def. a "roughly spherical region of space composed of comet-like bodies and other minor planets and asteroids that orbit distantly in planetary systems"[103] is called an Oort cloud.
Def. a "roughly spherical region of space from 50,000 to 100,000 astronomical units (approximately 1 light year) from the sun; supposedly the source of most comets around the Solar System"[104] is called an Oort Cloud.
50000 Quaoar
{{free media}}
{{free media}}
50000 Quaoar, provisional designation 2002 LM60, is a non-resonant trans-Neptunian object (classical Kuiper belt object, or cubewano) and a possible dwarf planet in the Kuiper belt, a region of icy planetesimals beyond Neptune measuring approximately 1,100 km (683.5083112 mi) in diameter, about half the diameter of Pluto, discovered at the Palomar Observatory on 6 June 2002.[105] Signs of water ice on the surface of Quaoar have been found, which suggests that cryovolcanism may be occurring on Quaoar.[106] A small amount of methane is present on its surface, which can only be retained by the largest Kuiper belt objects.[107] In February 2007, Weywot, a synchronous minor-planet moon in orbit around Quaoar, was discovered by Brown.[108] Weywot is measured to be 80 km (49.70969536 mi) across. Both objects were named after mythological figures from the Native American Tongva people in Southern California. Quaoar is the Tongva creator deity and Weywot is his son.[109]
The earliest precovery, or prediscovery image, of Quaoar was found on a photographic plate imaged on 25 May 1954 from the Palomar Observatory Sky Survey.[110]
Quaoar's albedo or reflectivity could be as low as 0.1, which would still be much higher than the lower estimate of 0.04 for 20000 Varuna. This may indicate that fresh ice has disappeared from Quaoar's surface.[111] The surface is moderately red, meaning that Quaoar is relatively more reflective in the red and near-infrared spectrum than in the blue.[112] The Kuiper belt objects Varuna and Ixion are also moderately red in the spectral class. Larger Kuiper belt objects are often much brighter because they are covered in more fresh ice and have a higher albedo, and thus they present a neutral color.[113] A 2006 model of internal heating via radioactive decay suggested that, unlike 90482 Orcus, Quaoar may not be capable of sustaining an internal ocean of liquid water at the mantle–core boundary.[114]
The presence of methane and other volatiles on Quaoar's surface suggest that it may support a tenuous atmosphere produced from the sublimation of volatiles.[115] With a measured mean temperature of ~ 44 K (−229.15 °C), the upper limit of Quaoar's atmospheric pressure is expected to be in the range of a few microbars.[115] Due to Quaoar's small size and mass, the possibility of Quaoar having an atmosphere of nitrogen and carbon monoxide has been ruled out, since the gases would escape from Quaoar.[115] The possibility of a methane atmosphere still remains, with the upper limit being less than 1 microbar.[116][115] In 2013, Quaoar occulted a 15.8 magnitude star and revealed no sign of a substantial atmosphere, placing an upper limit to at least 20 nanobars, under the assumption that Quaoar's mean temperature is 42 K (−231.15 °C) and that its atmosphere consists of mostly methane.[116][115]
Quaoar is thought to be an oblate spheroid around 1,100 km (683.5083112 mi) in diameter, being slightly flattened in shape.[116] The estimates come from observations of Quaoar as it occulted a 15.8 magnitude star in 2013.[116] Given that Quaoar has an estimated oblateness value of 0.0897±0.006 and a measured equatorial diameter of 1138+48
−34 km, Quaoar is believed to be in hydrostatic equilibrium, being described as a Maclaurin spheroid.[116] Quaoar is about as large and massive as (if somewhat smaller than) Pluto's moon Charon.[lower-alpha 1] Quaoar is roughly half the size of Pluto.[119]
Interstellar medium
The "many other types of radio sources in our galaxy [...] include so-called radio stars, emission nebula, flare stars and pulsars. [...] Pulsars were first discovered in 1967 by Cambridge post-graduate student Jocelyn Bell as she processed charts associated with an unrelated project to study twinkling radio sources. She noticed recurrent signals when the antenna was pointed in a certain direction. Further study revealed a precise timing interval of about 1 second. It also was found that the pulses were dispersed such that the lower frequencies arrived later than the higher frequencies. This dispersion could be attributed to scattering of the radiation by interstellar electrons and, if so, could provide an indication of the pulsar distance."[120]
"A particular subject of interest is the cluster ion series (NH3)nNH4+, since it is the dominant group of ions over the whole investigated temperature range."[121] For astrochemisty, "[t]hese studies are expected to throw light on the sputtering from planetary and interstellar ices and the possible formation of new organic molecules in CO--NH3–H2O ice by megaelectronvolt ion bombardment."[121]
"lnterstellar scintillation (ISS), fluctuations in the amplitude and phase of radio waves caused by scattering in the interstellar medium, is important as a diagnostic of interstellar plasma turbulence. ISS is also of interest because it is noise for other radio astronomical observations. [As a remote, sensing tool, ISS is used to diagnose the plasma turbulence in the interstellar medium (lSM). However, where ISS acts as a noise source in other observations, the plasma physics of the medium is only of secondary interest.] The unifying concern is the power spectrum of the interstellar electron density."[122]
"From measurements of angular broadening of pulsars and extragalactic sources, decorrelation bandwidth of pulsars, refractive steering of features in pulsar dynamic spectra, dispersion measure fluctuations of pulsars, and refractive scintillation index measurements, [...] a composite structure function that is approximately power law over 2 x 10⁶ m < scale < 1013 m [is constructed]. The data are consistent with the structure function having a logarithmic slope versus baseline Iess than 2; thus there is a meaningful connection between scales in the radiowave fluctuation field and the scales in the electron density field causing the scattering."[122]
A "composite electron density spectrum [is] approximately power law over at least the ≈ 5 decade wavenumber range 10-13 m-1 < wavenumber < 10-8 m-1 and that may extend to higher wavenumbers."[122]
Interstellar clouds
Def. an increase in the hydrogen density (nH) of the interstellar medium from ~ 0.01 H cm-3 to ≳ 0.1 H cm-3 is called an interstellar cloud.[123]
The cyanide radical (called cyanogen) is used to measure the temperature of interstellar gas clouds.[124]
"Carbon monoxide is the second most abundant molecule, after H2, in interstellar clouds. In diffuse clouds, the amount of CO is mainly derived from measurements of absorption at UV wavelengths."[125]
Circumstellar clouds
Def. an interstellar-like cloud apparently surrounding or in orbit around a star is called a circumstellar cloud.
"VY Canis Majoris [a red hypergiant star is] an irregular pulsating variable [that] lies about 5,000 light-years away in the constellation Canis Major."[126]
"Although VY Can is about half a million times as luminous as the Sun, much of its visible light is absorbed by a large, asymmetric cloud of dust particles that has been ejected from the star in various outbursts over the past 1,000 years or so. The infrared emission from this dust cloud makes VY Can one of the brightest objects in the sky at wavelengths of 5–20 microns."[126]
"In 2007, a team of astronomers using the 10-meter radio dish on Mount Graham, in Arizona, found that VY Can's extended circumstellar cloud is a prolific molecule-making factory. Among the radio emissions identified were those of hydrogen cyanide (HCN), silicon monoxide (SiO), sodium chloride (NaCl) and a molecule, phosphorus nitride (PN), in which a phosphorus atom and a nitrogen atom are bound together. Phosphorus-bearing molecules are of particular interest to astrobiologists because phosphorus is relatively rare in the universe, yet it is a key ingredient in molecules that are central to life as we know it, including the nuclei acids DNA and RNA and the energy-storage molecule, ATP. "[126]
"Material ejected by the star is visible in this 2004 image [on the top right] captured by the Hubble Space Telescope's Advanced Camera for Surveys, using polarizing filters."[126]
For comparison, the second image down on the right is captured using visuals.
Star-forming regions
"Newborn stars peek out from beneath their natal blanket of dust in this dynamic image of the Rho Ophiuchi dark cloud [in the image at right] from NASA's Spitzer Space Telescope. Called "Rho Oph" by astronomers, it's one of the closest star-forming regions to our own solar system. Located near the constellations Scorpius and Ophiuchus, the nebula is about 407 light years away from Earth."[127]
"Rho Oph is a complex made up of a large main cloud of molecular hydrogen, a key molecule allowing new stars to form from cold cosmic gas, with two long streamers trailing off in different directions. Recent studies using the latest X-ray and infrared observations reveal more than 300 young stellar objects within the large central cloud. Their median age is only 300,000 years, very young compared to some of the universe's oldest stars, which are more than 12 billion years old."[127]
"This false-color image of Rho Oph's main cloud, Lynds 1688, was created with data from Spitzer's infrared array camera, which has the highest spatial resolution of Spitzer's three imaging instruments. Blue represents 3.6 micron light, green is 4.5 micron light, orange is 5.8, and red is 8.0. The multiple wavelengths reveal different aspects of the dust surrounding and between the embedded stars, yielding information about the stars and their birthplace."[127]
"The colors in this image reflect the relative temperatures and evolutionary states of the various stars. The youngest stars are surrounded by dusty disks of gas from which they, and their potential planetary systems, are forming. These young disk systems show up as yellow-green tinted stars in this image. Some of these young stellar objects are surrounded by their own compact nebulae. More evolved stars, which have shed their natal material, are blue-white."[127]
Wolf-Rayet stars
"At the low density given by the spherically symmetric wind model (see Table 1), the dominant species in the gas are atomic ions while as the gas number density increases, the recombination of ions takes place and the gas composition is governed by neutral-phase chemistry, that is, the dominant species are neutral atoms and molecules although electrons and some ions are still present in relatively large amounts (for example, C+, O+ and He+)."[128]
Spectroscopy
By comparing astronomical observations with laboratory measurements, astrochemists can infer the elemental abundances, chemical composition, and temperatures of stars and interstellar clouds. This is possible because ions, atoms, and molecules have characteristic spectra: that is, the absorption and emission of certain wavelengths (colors) of light, often not visible to the human eye. However, these measurements have limitations, with various types of radiation (radio, infrared, visible, ultraviolet etc.) able to detect only certain types of species, depending on the chemical properties of the molecules. Interstellar formaldehyde was the first polyatomic organic molecule detected in the interstellar medium.
Acknowledgements
The content on this page was first contributed by: Henry A. Hoff.
Initial content for this page in some instances came from Wikiversity.
See also
References
- ↑ 1.0 1.1 1.2 1.3 M. Groenewegen (November 27, 2009). SPIRE spectrum of VY Canis Majoris. Pasadena, California USA: Caltech. Retrieved 2014-03-12.
- ↑ 2.0 2.1 C.-I. MengR. E. Huffman (1984). "Ultraviolet imaging from space of the aurora under full sunlight". Geophysical Research Letters. 11 (4): 315–8. doi:10.1029/GL011i004p00315. Retrieved 2013-05-31. Unknown parameter
|month=ignored (help) - ↑ 3.0 3.1 3.2 3.3 3.4 3.5 3.6 3.7 G. Toller, H. Tanabe, and J. L. Weinberg (1987). "Background starlight at the north and south celestial, ecliptic, and galactic poles". Astronomy and Astrophysics. 188 (1): 24–34. Bibcode:1987A&A...188...24T. Retrieved 2013-05-31. Unknown parameter
|month=ignored (help) - ↑ 4.0 4.1 C. Arpigny; R. Schulz; J. Manfroid; I. Ilyin; J. A. Stüwe; J.-M. Zucconi (2000). "The isotope ratios 12C/13C and 14N/15N in comet C/1995 O1 (Hale-Bopp)". Bulletin of the American Astronomical Society. 32 (10): 1074. Bibcode:2000DPS....32.4114A. Retrieved 2013-12-20. Unknown parameter
|month=ignored (help) - ↑ 5.0 5.1 eso1137a (October 3, 2011). Antennae Galaxies composite of ALMA and Hubble observations. Parana, Chile: European Southern Observatory. Retrieved 2014-03-13.
- ↑ 6.0 6.1 6.2 P. Sonnentrucker, D. A. Neufeld, T. G. Phillips, M. Gerin, D. C. Lis, M. De Luca, J. R. Goicoechea, J. H. Black, T. A. Bell, F. Boulanger, J. Cernicharo, A. Coutens, E. Dartois, M . Kaźmierczak, P. Encrenaz, E. Falgarone, T. R. Geballe, T. Giesen, B. Godard, P. F. Goldsmith, C. Gry, H. Gupta, P. Hennebelle, E. Herbst, P. Hily-Blant, C. Joblin, R. Kołos, J. Krełowski, J. Martín-Pintado, K. M. Menten, R. Monje, B. Mookerjea, J. Pearson, M. Perault, C. M. Persson, R. Plume, M. Salez, S. Schlemmer, M. Schmidt, J. Stutzki, D.Teyssier, C. Vastel, S. Yu, E. Caux, R. Güsten, W. A. Hatch, T. Klein, I. Mehdi, P. Morris and J. S. Ward (2010). "Detection of hydrogen fluoride absorption in diffuse molecular clouds with Herschel/HIFI: a ubiquitous tracer of molecular gas" (PDF). Astronomy & Astrophysics. 521: 5. doi:10.1051/0004-6361/201015082. Retrieved 2013-01-17. Unknown parameter
|month=ignored (help) - ↑ D. C. Lis, J. C. Pearson, D. A. Neufeld, P. Schilke, H. S. P. Müller,H. Gupta, T. A. Bell, C. Comito, T. G. Phillips, E. A. Bergin, C. Ceccarelli, P. F. Goldsmith, G. A. Blake, A. Bacmann, A. Baudry, M. Benedettini, A. Benz, J. Black, A. Boogert, S. Bottinelli, S. Cabrit, P. Caselli, A. Castets, E. Caux, J. Cernicharo, C. Codella, A. Coutens, N. Crimier, N. R. Crockett, F. Daniel, K. Demyk, C. Dominic, M.-L. Dubernet, M. Emprechtinger, P. Encrenaz, E. Falgarone, A. Fuente, M. Gerin, T. F. Giesen, J. R. Goicoechea, F. Helmich, P. Hennebelle, Th. Henning, E. Herbst, P. Hily-Blant, Å. Hjalmarson, D. Hollenbach, T. Jack, C. Joblin, D. Johnstone, C. Kahane, M. Kama, M. Kaufman, A. Klotz, W. D. Langer, B. Larsson, J. Le Bourlot, B. Lefloch, F. Le Petit, D. Li, R. Liseau, S. D. Lord, A. Lorenzani, S. Maret, P. G. Martin, G. J. Melnick, K. M. Menten, P. Morris, J. A. Murphy, Z. Nagy, B. Nisini, V. Ossenkopf, S. Pacheco, L. Pagani, B. Parise, M. Pérault, R. Plume, S.-L. Qin, E. Roueff, M. Salez, A. Sandqvist, P. Saraceno, S. Schlemmer, K. Schuster, R. Snell, J. Stutzki, A. Tielens, N. Trappe, F. F. S. van der Tak, M. H. D. van der Wiel, E. van Dishoeck, C. Vastel, S. Viti, V. Wakelam, A. Walters, S. Wang, F. Wyrowski, H. W. Yorke, S. Yu, J. Zmuidzinas, Y. Delorme, J.-P. Desbat, R. Güsten, J.-M. Krieg, and B. Delforge (2010). "Herschel/HIFI discovery of interstellar chloronium (H2Cl+)" (PDF). Astronomy & Astrophysics. 521: 5. doi:10.1051/0004-6361/201014959. Retrieved 2013-01-18. Unknown parameter
|month=ignored (help) - ↑ 8.0 8.1 Lewis E. Snyder, David Buhl, B. Zuckerman, Patrick Palmer (1969). "Microwave detection of interstellar formaldehyde". Physical Review Letters. 22 (13): 679–81. doi:10.1103/PhysRevLett.22.679. Retrieved 2011-12-17. Unknown parameter
|month=ignored (help) - ↑ http://www.cfa.harvard.edu/mmw/CO_survey_aitoff.jpg.
- ↑ Kuan YJ, Charnley SB, Huang HC; et al. (2003). "Interstellar glycine". The Astrophysical Journal. 593 (2): 848–867. Bibcode:2003ApJ...593..848K. doi:10.1086/375637.
- ↑ Snyder LE, Lovas FJ, Hollis JM; et al. (2005). "A rigorous attempt to verify interstellar glycine". The Astrophysical Journal. 619 (2): 914–30. arXiv:astro-ph/0410335. Bibcode:2005ApJ...619..914S. doi:10.1086/426677.
- ↑ L. G. Henyey (1936). "On the Polarization of Light in Reflection Nebulae". The Astrophysical Journal. 84 (12): 609–18. Bibcode:1936ApJ....84..609H. doi:10.1086/143787. Retrieved 1 June 2013. Unknown parameter
|month=ignored (help) - ↑ 13.0 13.1 13.2 13.3 Lucas Cieza, Luisa Rebull, and Jes Jorgensen (October 25, 2006). Perseus' Stellar Neighbors. Pasadena, California USA: NASA/JPL/California Institute of Technology. Retrieved 2014-03-06.
- ↑ 14.0 14.1 14.2 14.3 SPACE.com Staff (January 14, 2013). Baffling Star Birth Mystery Finally Solved. Yahoo! Inc. Retrieved 2013-01-15.
- ↑ A. Ginsburg, E. Bressert, J. Bally, C. Battersby (2012). "There are No Starless Massive Proto-Clusters in the First Quadrant of the Galaxy" (PDF). The Astrophysical Journal Letters. 758 (2): L29–33. arXiv:1208.4097. Bibcode:2012ApJ...758L..29G. doi:10.1088/2041-8205/758/2/L29. Retrieved 2013-01-15. Unknown parameter
|month=ignored (help) - ↑ SemperBlotto (20 April 2006). molecular cloud. San Francisco, California: Wikimedia Foundation, Inc. Retrieved 2015-09-30.
- ↑ 17.0 17.1 17.2 17.3 eso0102 (10 January 2001). How to Become a Star. European Southern Observatory. Retrieved 2015-09-30.
- ↑ Robert Nemiroff (MTU) & Jerry Bonnell (USRA) (June 30, 2003). Disappearing Clouds in Carina. Goddard Space Flight Center, Greenbelt, Maryland, USA: NASA. Retrieved 2012-09-05.
- ↑ Craig Kulesa. Overview: Molecular Astrophysics and Star Formation. Retrieved September 7, 2005.
- ↑ 20.0 20.1 See, e.g., Table 1 and the Appendix of Murray, N. (2011). "Star Formation Efficiencies and Lifetimes of Giant Molecular Clouds in the Milky Way". The Astrophysical Journal. 729 (2): 133. arXiv:1007.3270. Bibcode:2011ApJ...729..133M. doi:10.1088/0004-637X/729/2/133.
- ↑ J. P. Williams, L. Blitz, C. F. McKee (2000). The Structure and Evolution of Molecular Clouds: from Clumps to Cores to the IMF, In: Protostars and Planets IV. Tucson: University of Arizona Press. p. 97.
- ↑ Di Francesco, J.; et al. (2006). An Observational Perspective of Low-Mass Dense Cores I: Internal Physical and Chemical Properties, In: Protostars and Planets V.
- ↑ Grenier (2004). The Gould Belt, star formation, and the local interstellar medium, In: The Young Universe.
- ↑ Sagittarius B2 and its Line of Sight
- ↑ Krasnopolsky, V. A.; Parshev, V. A. (1981). "Chemical composition of the atmosphere of Venus". Nature. 292 (5824): 610–613. Bibcode:1981Natur.292..610K. doi:10.1038/292610a0.
- ↑ Vladimir A. Krasnopolsky (2006). "Chemical composition of Venus atmosphere and clouds: Some unsolved problems". Planetary and Space Science. 54 (13–14): 1352–1359. Bibcode:2006P&SS...54.1352K. doi:10.1016/j.pss.2006.04.019.
- ↑ W. B., Rossow; A. D., del Genio; T., Eichler (1990). "Cloud-tracked winds from Pioneer Venus OCPP images". Journal of the Atmospheric Sciences. 47 (17): 2053–2084. Bibcode:1990JAtS...47.2053R. doi:10.1175/1520-0469(1990)047<2053:CTWFVO>2.0.CO;2. ISSN 1520-0469.
- ↑ Normile, Dennis (7 May 2010). "Mission to probe Venus's curious winds and test solar sail for propulsion". Science. 328 (5979): 677. Bibcode:2010Sci...328..677N. doi:10.1126/science.328.5979.677-a. PMID 20448159.
- ↑ E. C. Roelof, D. G. Mitchell, D. J. Williams (1985). "Energetic neutral atoms (E ∼ 50 keV) from the ring current: IMP 7/8 and ISEE 1". Journal of Geophysical Research. 90 (A11): 10, 991–11, 008. doi:10.1029/JA090iA11p10991. Retrieved 2012-08-12.
- ↑ D. G. Mitchell, K. C. Hsieh, C. C. Curtis, D. C. Hamilton, H. D. Voes, E. C, Roelof, P. C:son-Brandt (2001). "Imaging two geomagnetic storms in energetic neutral atoms". Geophysical Research Letters. 28 (6): 1151–4. doi:10.1029/2000GL012395. Retrieved 2012-08-12.
- ↑ Dan Burbank (December 21, 2011). Love and Joy for the New Year. International Space Station: NASA's Earth Observatory. Retrieved 2012-07-22.
- ↑ European Space Agency (9 April 2015). Aurora over Icelandic Lake. ESA. Retrieved 2015-04-12.
- ↑ Marilia Samara (7 October 2015). Unexpected role of electrons in creating pulsating auroras. Greenbelt, Maryland USA: NASA/Goddard Space Flight Center. Retrieved 2015-12-01.
- ↑ Sarah Frazier (30 November 2015). NASA Plans Twin Sounding Rocket Launches over Norway this Winter. Washington, DC USA: NASA. Retrieved 2015-11-30.
- ↑ A. Bhardwaj & R. Elsner (February 20, 2009). Earth Aurora: Chandra Looks Back At Earth. 60 Garden Street, Cambridge, MA 02138 USA: Harvard-Smithsonian Center for Astrophysics. Retrieved 2013-05-10.
- ↑ Andrew Wright (9 April 2015). Heart of the Black Auroras Revealed by Cluster. European Space Agency. Retrieved 2015-04-12.
- ↑ rgk (July 2012). AURORA [POLARIS]. Albany, New York USA: University of New York at Albany. Retrieved 2015-12-02.
- ↑ Rob Gutro (4 April 2005). Earth's Auroras Don't Mirror. Washington, DC USA: NASA. Retrieved 2015-11-27.
- ↑ 39.0 39.1 Donald M. Hunten (February 12, 1993). "Atmospheric Evolution of the Terrestrial Planets" (PDF). Science. 259 (5097): 915–20. Retrieved 2014-09-21.
- ↑ K. Dennerl (2002). "Discovery of X-rays from Mars with Chandra". Astronomy & Astrophysics. 394 (11): 1119–28. Bibcode:2002A&A...394.1119D. doi:10.1051/0004-6361:20021116. Unknown parameter
|month=ignored (help);|access-date=requires|url=(help) - ↑ A. J. Kliore, A. Anabtawi, R. G. Herrera; et al. (2002). "Ionosphere of Callisto from Galileo radio occultation observations". Journal of Geophysics Research. 107 (A11): 1407. Bibcode:2002JGRA.107kSIA19K. doi:10.1029/2002JA009365.
- ↑ 42.0 42.1 Sang J. Kim, John Caldwell, A.R. Rivolo, R. Wagener, Glenn S. Orton (1985). "Infrared polar brightening on Jupiter. III - Spectrometry from the Voyager 1 IRIS experiment". Icarus. 64 (2): 233–48. Bibcode:1985Icar...64..233K. doi:10.1016/0019-1035(85)90088-0. Retrieved 2012-07-09. Unknown parameter
|month=ignored (help) - ↑ Sue Lavoie (December 31, 2010). Acetylene at Jupiter's North and South Poles. Ministry of Space Exploration. Retrieved 2013-02-06.
- ↑ Hall, Doyle T.; et al.; Detection of an oxygen atmosphere on Jupiter's moon Europa, Nature, Vol. 373 (23 February 1995), pp. 677–679 (accessed 15 April 2006)
- ↑ Donald Savage, Tammy Jones, and Ray Villard (1995-02-23). Hubble Finds Oxygen Atmosphere on Europa, In: Project Galileo. NASA, Jet Propulsion Laboratory. Retrieved 2007-08-17.
- ↑ McGrath (2009). "Atmosphere of Europa". In Pappalardo, Robert T.; McKinnon, William B.; and Khurana, Krishan K. Europa. University of Arizona Press. ISBN 0-8165-2844-6.
- ↑ Arvydas J. Kliore, D. P. Hinson, F. Michael Flasar, Andrew F. Nagy, Thomas E. Cravens (1997). "The Ionosphere of Europa from Galileo Radio Occultations". Science. 277 (5324): 355–8. Bibcode:1997Sci...277..355K. doi:10.1126/science.277.5324.355. PMID 9219689. Retrieved 2007-08-10. Unknown parameter
|month=ignored (help) - ↑ Galileo Spacecraft Finds Europa has Atmosphere, In: Project Galileo. NASA, Jet Propulsion Laboratory. July 1997. Retrieved 2007-08-10.
- ↑ William H. Smyth, Max L. Marconi (2006). "Europa's atmosphere, gas tori, and magnetospheric implications". Icarus. 181 (2): 510. Bibcode:2006Icar..181..510S. doi:10.1016/j.icarus.2005.10.019.
- ↑ 50.0 50.1 50.2 Sue Lavoie (31 May 2001). PIA03450: Io Color Eclipse Movie. Tucson, Arizona USA: NASA/JPL/University of Arizona. Retrieved 30 May 2013.
- ↑ 51.0 51.1 51.2 Erich Karkoschka (May 26, 2004). Saturn Seen from Far and Near. Baltimore, Maryland USA: Hubble Site. Retrieved 2014-02-26.
- ↑ 52.0 52.1 52.2 Jia-Rui C. Cook, Joe Mason, and Michael Buckley (March 17, 2011). Cassini Sees Seasonal Rains Transform Titan's Surface. Pasadena, California USA: NASA/JPL. Retrieved 2013-04-12.
- ↑ Elizabeth Turtle (March 17, 2011). Cassini Sees Seasonal Rains Transform Titan's Surface. Pasadena, California USA: NASA/JPL. Retrieved 2013-04-12.
- ↑ Tony Del Genio (March 17, 2011). Cassini Sees Seasonal Rains Transform Titan's Surface. Pasadena, California USA: NASA/JPL. Retrieved 2013-04-12.
- ↑ 55.0 55.1 55.2 Sue Lavoie (March 17, 2011). PIA12810: Equatorial Titan Clouds. Pasadena, California USA: NASA/JPL. Retrieved 2013-04-12.
- ↑ 56.0 56.1 56.2 Sue Lavoie (January 29, 2009). PIA11147: Changes in Titan's Lakes. Pasadena, California USA: NASA/JPL. Retrieved 2013-06-13.
- ↑ Sue Lavoie (January 29, 2009). PIA11146: Maps of Titan - January 2009. Pasadena, California USA: NASA/JPL. Retrieved 2013-06-13.
- ↑ Jonathan I. Lunine (1993). "The Atmospheres of Uranus and Neptune". Annual Review of Astronomy and Astrophysics. 31: 217–63. Bibcode:1993ARA&A..31..217L. doi:10.1146/annurev.aa.31.090193.001245.
- ↑ Nowak, Gary T. (2006). Uranus: the Threshold Planet of 2006. Retrieved June 14, 2007.
- ↑ 60.0 60.1 Smith, B. A.; Soderblom, L. A.; Beebe, A.; Bliss, D.; Boyce, J. M.; Brahic, A.; Briggs, G. A.; Brown, R. H. et al (4 July 1986). "Voyager 2 in the Uranian System: Imaging Science Results". Science 233 (4759): 43–64. Bibcode 1986Sci...233...43S. doi:10.1126/science.233.4759.43. PMID 17812889
- ↑ 61.0 61.1 61.2 Emily Lakdawalla (2004). No Longer Boring: 'Fireworks' and Other Surprises at Uranus Spotted Through Adaptive Optics. Archived from the original on May 25, 2006. Retrieved June 13, 2007.
- ↑ 62.00 62.01 62.02 62.03 62.04 62.05 62.06 62.07 62.08 62.09 62.10 Sromovsky, L. A.; Fry, P. M. (December 2005). "Dynamics of cloud features on Uranus". Icarus 179 (2): 459–484. Bibcode 2005Icar..179..459S. doi:10.1016/j.icarus.2005.07.022.
- ↑ Karkoschka, Erich (May 2001). "Uranus' Apparent Seasonal Variability in 25 HST Filters". Icarus 151 (1): 84–92. Bibcode 2001Icar..151...84K. doi:10.1006/icar.2001.6599.
- ↑ 64.0 64.1 64.2 64.3 Hammel, H. B.; de Pater, I.; Gibbard, S. G.; Lockwood, G. W.; Rages, K. (May 2005). "New cloud activity on Uranus in 2004: First detection of a southern feature at 2.2 µm". Icarus 175 (1): 284–288. Bibcode 2005Icar..175..284H. doi:10.1016/j.icarus.2004.11.016.
- ↑ 65.0 65.1 L. Sromovsky, Fry, P., Hammel, H., Rages, K. Hubble Discovers a Dark Cloud in the Atmosphere of Uranus (PDF). physorg.com. Retrieved August 22, 2007.
- ↑ H.B. Hammel and G.W. Lockwood (2007). "Long-term atmospheric variability on Uranus and Neptune". Icarus. 186: 291–301. Bibcode:2007Icar..186..291H. doi:10.1016/j.icarus.2006.08.027.
- ↑ Devitt, Terry (2004). Keck zooms in on the weird weather of Uranus. University of Wisconsin-Madison. Retrieved December 24, 2006.
- ↑ 68.0 68.1 Rages, K. A.; Hammel, H. B.; Friedson, A. J. (11 September 2004). "Evidence for temporal change at Uranus' south pole". Icarus 172 (2): 548–554. Bibcode 2004Icar..172..548R. doi:10.1016/j.icarus.2004.07.009
- ↑ 69.0 69.1 Hammel, H. B.; de Pater, I.; Gibbard, S. G.; Lockwood, G. W.; Rages, K. (June 2005). "Uranus in 2003: Zonal winds, banded structure, and discrete features" (PDF). Icarus 175 (2): 534–545. Bibcode 2005Icar..175..534H. doi:10.1016/j.icarus.2004.11.012
- ↑ Hanel, R.; Conrath, B.; Flasar, F. M.; Kunde, V.; Maguire, W.; Pearl, J.; Pirraglia, J.; Samuelson, R. et al (4 July 1986). "Infrared Observations of the Uranian System". Science 233 (4759): 70–74. Bibcode 1986Sci...233...70H. doi:10.1126/science.233.4759.70. PMID 17812891.
- ↑ Hammel, H. B.; Rages, K.; Lockwood, G. W.; Karkoschka, E.; de Pater, I. (October 2001). "New Measurements of the Winds of Uranus". Icarus 153 (2): 229–235. Bibcode 2001Icar..153..229H. doi:10.1006/icar.2001.6689.
- ↑ D. Crisp, H. B. Hammel (14 June 1995). Hubble Space Telescope Observations of Neptune. Hubble News Center. Retrieved 22 April 2007.
- ↑ Kirk Munsell, Smith, Harman; Harvey, Samantha (13 November 2007). Neptune overview, In: Solar System Exploration. NASA. Retrieved 20 February 2008.
- ↑ Rnt20 (8 January 2007). "Stardust (spacecraft)". San Francisco, California: Wikimedia Foundation, Inc. Retrieved 5 July 2019.
- ↑ astronomie, astéroïdes et comètes
- ↑ Duncan, M.; Quinn, T.; Tremaine, S. (1987). "The Formation and Extent of the Solar System Comet Cloud". The Astronomical Journal. 94: 1330. Bibcode:1987AJ.....94.1330D. doi:10.1086/114571.
- ↑ J. A. Fernandez (1997). "The Formation of the Oort cloud and the Primitive Galactic Environment". Icarus. Vol. 129 no. 1. pp. 106–119. Bibcode:1997Icar..129..106F. doi:10.1006/icar.1997.5754.
- ↑ 78.0 78.1 78.2 Jack G. Hills (1981). "Comet showers and the steady-state infall of comets from the Oort Cloud". Astronomical Journal. 86: 1730–1740. Bibcode:1981AJ.....86.1730H. doi:10.1086/113058.
- ↑ "Planetary Sciences: American and Soviet Research, Proceedings from the U.S.-U.S.S.R. Workshop on Planetary Sciences, p. 251". 1991. Retrieved November 7, 2007.
- ↑ Ernst Öpik (1932). "Note on Stellar Perturbations of Nearby Parabolic Orbits". Proceedings of the American Academy of Arts and Sciences. 67: 169–182.
- ↑ 81.0 81.1 81.2 Jan Oort (1950). "The Structure of the Cloud of Comets Surrounding the Solar System and a Hypothesis Concerning its Origin". Bull. Astron. Inst. Neth. 11: 91–110. Bibcode:1950BAN....11...91O.
- ↑ Dave E. Matson (May 2012). "Young Earth Evidence – Short-period Comets". Young Earth Creationism.
- ↑ 83.0 83.1 Bailey, M. E.; Stagg, C. R. (1988). "Cratering constraints on the inner Oort cloud : Steady-state models". Monthly Notices of the Royal Astronomical Society. 235: 1–32. Bibcode:1988MNRAS.235....1B. doi:10.1093/mnras/235.1.1.
- ↑ Bailey, M. E.; Stagg, C. R. (1988). "Cratering constraints on the inner Oort cloud : Steady-state models". Monthly Notices of the Royal Astronomical Society. 235: 1–32. Bibcode:1988MNRAS.235....1B. doi:10.1093/mnras/235.1.1.
- ↑ Matt Williams (10 August 2015). "What is the Oort Cloud?". Universe Today. Retrieved February 20, 2016.
- ↑ The Formation and Extent of the Solar System Comet Cloud
- ↑ E. L. Gibb, M. J. Mumma, N. Dello Russo, M. A. DiSanti and K. Magee-Sauer (2003). "Methane in Oort Cloud comets".
- ↑ P. R. Weissman; H. F. Levison (October 1997). "Origin and Evolution of the Unusual Object 1996 PW: Asteroids from the Oort Cloud?". Astrophysical Journal Letters. 488: L133. Bibcode:1997ApJ...488L.133W. doi:10.1086/310940.
- ↑ D. Hutsemekers, J. Manfroid, E. Jehin, C. Arpigny, A. Cochran, R. Schulz, J.A. Stüwe, and J.M. Zucconi (2005). "Isotopic abundances of carbon and nitrogen in Jupiter-family and Oort Cloud comets".
- ↑ Michael J. Mumma, Michael A. DiSanti, Karen Magee-Sauer et al. (2005). "Parent Volatiles in Comet 9P/Tempel 1: Before and After Impact". Science Express 310 (5746): 270–274.
- ↑ Clavin, Whitney; Harrington, J.D. (25 April 2014). "NASA's Spitzer and WISE Telescopes Find Close, Cold Neighbor of Sun". NASA. Archived from the original on 26 April 2014. Retrieved 25 April 2014.
- ↑ Fred Lawrence Whipple, G. Turner, J. A. M. McDonnell, M. K. Wallis (1987-09-30). "A Review of Cometary Sciences". Philosophical Transactions of the Royal Society A. Royal Society Publishing. 323 (1572): 339–347 [341]. Bibcode:1987RSPTA.323..339W. doi:10.1098/rsta.1987.0090.
- ↑ Alessandro Morbidelli (2006). Origin and dynamical evolution of comets and their reservoirs of water ammonia and methane. arXiv:astro-ph/0512256.
- ↑ Kuiper Belt & Oort Cloud. NASA. Retrieved 2011-08-08.
- ↑ Alessandro Morbidelli (2006). "Origin and dynamical evolution of comets and their reservoirs of water ammonia and methane". arXiv:astro-ph/0512256.
- ↑ 96.0 96.1 "Catalog Page for PIA17046". Photo Journal. NASA. Retrieved April 27, 2014.
- ↑ "New Horizons Salutes Voyager". New Horizons. August 17, 2006. Archived from the original on March 9, 2011. Retrieved November 3, 2009.
- ↑ Clark, Stuart (September 13, 2013). "Voyager 1 leaving solar system matches feats of great human explorers". The Guardian.
- ↑ "Voyagers are leaving the Solar System". Space Today. 2011. Retrieved May 29, 2014.
- ↑ "It's Official: Voyager 1 Is Now In Interstellar Space". UniverseToday. 2013-09-12. Retrieved April 27, 2014.
- ↑ Ghose, Tia (September 13, 2013). "Voyager 1 Really Is In Interstellar Space: How NASA Knows". Space.com. TechMedia Network. Retrieved September 14, 2013.
- ↑ Cook, J.-R (September 12, 2013). "How Do We Know When Voyager Reaches Interstellar Space?". NASA / Jet Propulsion Lab. Retrieved September 15, 2013.
- ↑ 70.51.46.39 (17 March 2016). "Oort cloud". San Francisco, California: Wikimedia Foundation, Inc. Retrieved 19 June 2019.
- ↑ SemperBlotto (13 March 2005). "Oort Cloud". San Francisco, California: Wikimedia Foundation, Inc. Retrieved 19 June 2019.
- ↑ "50000 Quaoar (2002 LM60)". Minor Planet Center. Retrieved 30 November 2017.
- ↑ Crystalline Ice on Kuiper Belt Object (50000) Quaoar – article about crystalline ice on Quaoar
- ↑ Schaller, E. L.; Brown, M. E. (November 2007). "Detection of Methane on Kuiper Belt Object (50000) Quaoar". The Astrophysical Journal. 670 (1): L49–L51. arXiv:0710.3591. Bibcode:2007ApJ...670L..49S. doi:10.1086/524140.
- ↑ Daniel W. E. Green (2007-02-22). "IAUC 8812: Sats of 2003 AZ84, (50000), (55637), (90482)". International Astronomical Union Circular. Retrieved 2011-07-05.
- ↑ Schmadel, Lutz D. (2007). "(50000) Quaoar". Dictionary of Minor Planet Names – (50000) Quaoar. Springer Berlin Heidelberg. p. 895. doi:10.1007/978-3-540-29925-7_10041. ISBN 978-3-540-00238-3.
- ↑ "JPL Small-Body Database Browser: 50000 Quaoar (2002 LM60)" (2018-05-25 last obs.). Jet Propulsion Laboratory. Retrieved 27 February 2018.
- ↑ Fraser, Wesley C.; Brown, Michael E. (May 2010). "Quaoar: A Rock in the Kuiper Belt". The Astrophysical Journal. 714 (2): 1547–1550. arXiv:1003.5911. Bibcode:2010ApJ...714.1547F. doi:10.1088/0004-637X/714/2/1547.
- ↑ Jewitt, D.C.; J. Luu (2004). "Crystalline water ice on the Kuiper belt object (50000) Quaoar". Nature. 432 (7018): 731–3. Bibcode:2004Natur.432..731J. doi:10.1038/nature03111. PMID 15592406.. Reprint on Jewitt's site (pdf)
- ↑ Brown, Michael E. "The Largest Kuiper Belt Objects" (PDF). Retrieved 14 March 2019.
- ↑ Hussmann, Hauke; Sohl, Frank; Spohn, Tilman (November 2006). "Subsurface oceans and deep interiors of medium-sized outer planet satellites and large trans-neptunian objects". Icarus. 185 (1): 258–273. Bibcode:2006Icar..185..258H. doi:10.1016/j.icarus.2006.06.005.
- ↑ 115.0 115.1 115.2 115.3 115.4 Fraser, Wesley C.; Trujillo, Chad; Stephens, Andrew W.; Gimeno, German; Brown, Michael E.; Gwyn, Stephen; Kavelaars, J. J. (August 2013). "Limits on Quaoar's Atmosphere". The Astrophysical Journal Letters. 774 (2). arXiv:1308.2230. doi:10.1088/2041-8205/774/2/L18. Retrieved 26 March 2019.
- ↑ 116.0 116.1 116.2 116.3 116.4 Braga-Ribas, F.; Sicardy, B.; Ortiz, J. L.; Lellouch, E.; Tancredi, G.; Lecacheux, J.; et al. (August 2013). "The Size, Shape, Albedo, Density, and Atmospheric Limit of Transneptunian Object (50000) Quaoar from Multi-chord Stellar Occultations". The Astrophysical Journal. 773 (1): 13. Bibcode:2013ApJ...773...26B. doi:10.1088/0004-637X/773/1/26. Retrieved 27 February 2018.
- ↑ Template:Cite arxiv
- ↑ Fornasier, S.; Lellouch, E.; Müller, T.; Santos-Sanz, P.; Panuzzo, P.; Kiss, C.; et al. (July 2013). "TNOs are Cool: A survey of the trans-Neptunian region. VIII. Combined Herschel PACS and SPIRE observations of nine bright targets at 70-500 µm". Astronomy and Astrophysics. 555: 22. arXiv:1305.0449v2. Bibcode:2013A&A...555A..15F. doi:10.1051/0004-6361/201321329. Retrieved 27 February 2018.
- ↑ Brown, Michael E. (7 December 2010). "Chapter Five: An Icy Nail". How I Killed Pluto and Why It Had It Coming. Spiegel & Grau. pp. 63–85. ISBN 0-385-53108-7.
- ↑ Whitham D. Reeve (1973). Book Review (PDF). Anchorage, Alaska USA: Whitham D. Reeve. Retrieved 2014-01-11.
- ↑ 121.0 121.1 R. Martinez, L. S. Farenzena, P. Iza, C. R. Ponciano, M. G. P. Homem, A. Naves de Brito, K. Wien, E. F. da Silveira (2007). "Secondary ion emission induced by fission fragment impact in CO--NH3 and CO--NH3--H2O ices: modification in the CO--NH3 ice structure". Journal of Mass Spectrometry. 42 (10): 1333–41. doi:10.1002/jms.1241. Retrieved 2011-12-12. Unknown parameter
|month=ignored (help) - ↑ 122.0 122.1 122.2 J. W. Armstrong, B. J. Rickett, and S. R. Spangler (1995). "Electron density power spectrum in the local interstellar medium". The Astrophysical Journal. 443 (1): 209–21. Bibcode:1995ApJ...443..209A. doi:10.1086/175515. Retrieved 2014-01-29. Unknown parameter
|month=ignored (help) - ↑ Alfred Vidal-Madjar, Claudine Laurent, and Paul Bruston (15 July 1978). "Is the solar system entering a nearby interstellar cloud". The Astrophysical Journal. 223 (07): 589–600. Bibcode:1978ApJ...223..589V. doi:10.1086/156294. Retrieved 2015-09-30.
- ↑ Roth, K. C.; Meyer, D. M.; Hawkins, I. (1993). "Interstellar Cyanogen and the Temperature of the Cosmic Microwave Background Radiation" (PDF). The Astrophysical Journal. 413 (2): L67–L71. Bibcode:1993ApJ...413L..67R. doi:10.1086/186961.
- ↑ S.R. Federman, David L. Lambert (2002). [www.sciencedirect.com/science/article/pii/S0368204802000178 "The need for accurate oscillator strengths and cross sections in studies of diffuse interstellar clouds and cometary atmospheres"] Check
|url=value (help). Journal of Electron Spectroscopy and Related Phenomena. 123 (2–3): 161–71. Retrieved 2013-01-20. Unknown parameter|month=ignored (help); Unknown parameter|pdf=ignored (help) - ↑ 126.0 126.1 126.2 126.3 David Darling (2007). VY Canis Majoris. Encyclopedia of Science. Retrieved 7 October 2015.
- ↑ 127.0 127.1 127.2 127.3 G.G. Fazio, P.C. Myers, L. Allen, S.T. Megeath, E.T. Young, J. Muzerolle, N.J. Evans II, G.A. Blake, P.M. Harvey, D.W. Koerner, L.G. Mundy, D.L. Padgett, A.I. Sargent, K.R. Stapelfeldt, and E.F. van Dishoeck (February 11, 2008). Young Stars in Their Baby Blanket of Dust. Pasadena, California USA: NASA/JPL/Caltech. Retrieved 2014-03-06.
- ↑ I. Cherchneff, Y.H. Le Teuff, P.M. Williams, and A.G.G.M. Tielens (May 2000). "Dust formation in carbon-rich Wolf-Rayet stars. I. Chemistry of small carbon clusters and silicon species". Astronomy and Astrophysics. 357 (5): 572–80. Bibcode:2000A&A...357..572C. Retrieved 2011-12-05.
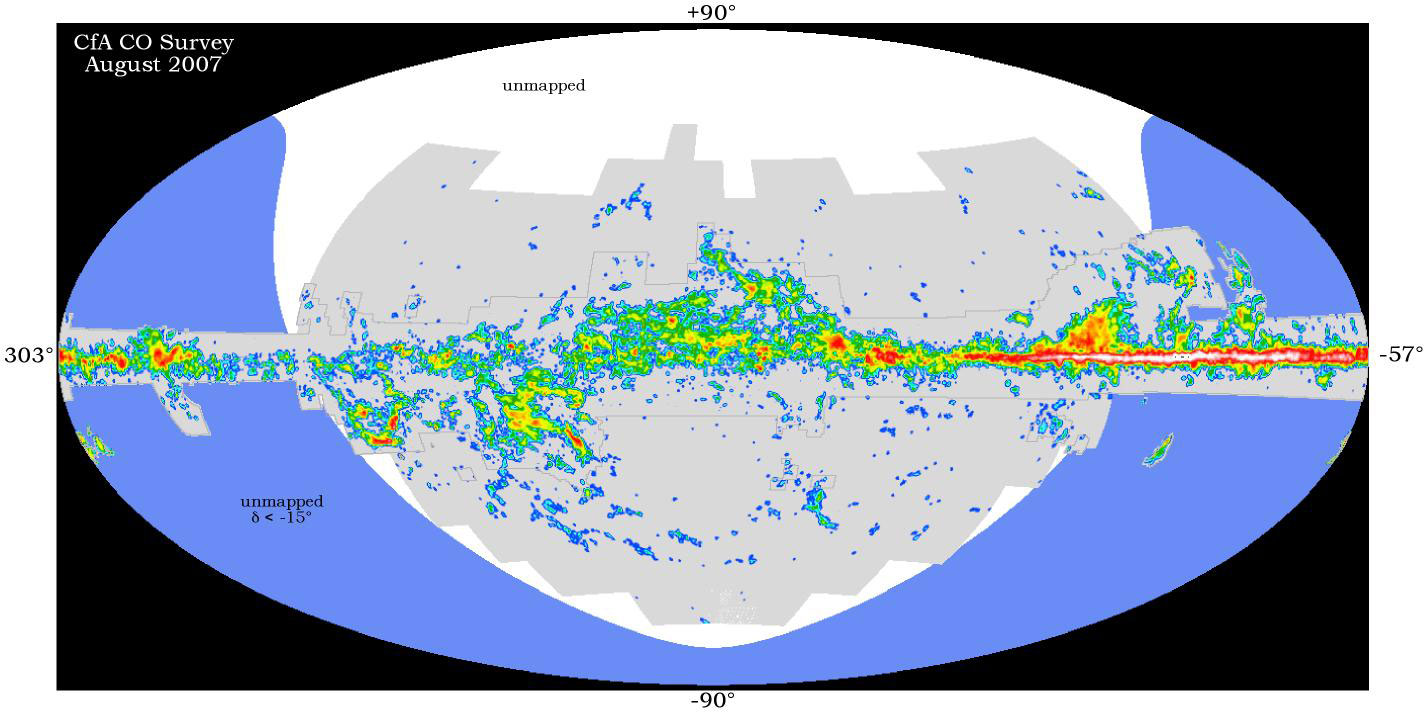
External links
Editor-In-Chief: Henry A Hoff
{{Principles of radiation astronomy}}Template:Sisterlinks
<ref> tags exist for a group named "lower-alpha", but no corresponding <references group="lower-alpha"/> tag was found
- Pages with non-numeric formatnum arguments
- Pages with citations using unsupported parameters
- CS1 maint: Multiple names: authors list
- CS1 maint: Explicit use of et al.
- Pages using citations with accessdate and no URL
- CS1 maint: Multiple names: editors list
- Pages with URL errors
- Pages with broken file links
- Radiation astronomy lectures
- Resources last modified in October 2019
- Pages with reference errors