Wolff-Parkinson-White syndrome EKG examples: Difference between revisions
No edit summary |
No edit summary |
||
| Line 109: | Line 109: | ||
[[Image:Wolf_Parkinson_White_syndrome.png|center|800px]] | [[Image:Wolf_Parkinson_White_syndrome.png|center|800px]] | ||
---- | |||
Shown below is an example of an ECG demonstrating a delta wave in lead V<sub>2</sub> along with left axis deviation. | |||
[[Image:WPW_syndrome_1.jpg|center|800px]] | |||
---- | ---- | ||
Revision as of 16:02, 16 October 2012
Editor-In-Chief: C. Michael Gibson, M.S., M.D. [1]
For the main page on Wolff-Parkinson-White syndrome click here
EKG examples
Shown below is an electrocardiogram of Wolff-Parkinson-White syndrome.

Shown below is an electrocardiogram of Wolff-Parkinson-White syndrome.
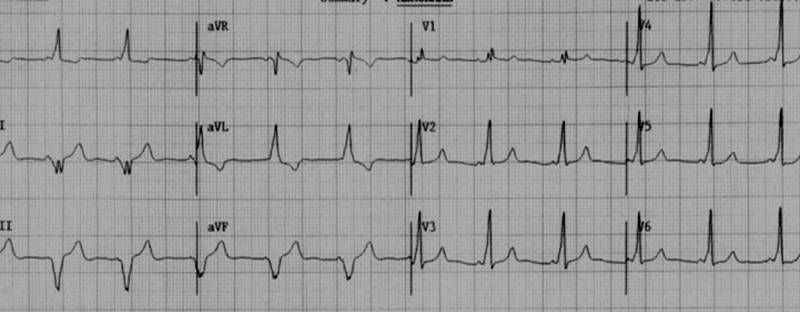
Shown below is an electrocardiogram of Wolff-Parkinson-White syndrome (antero-lateral pathway).
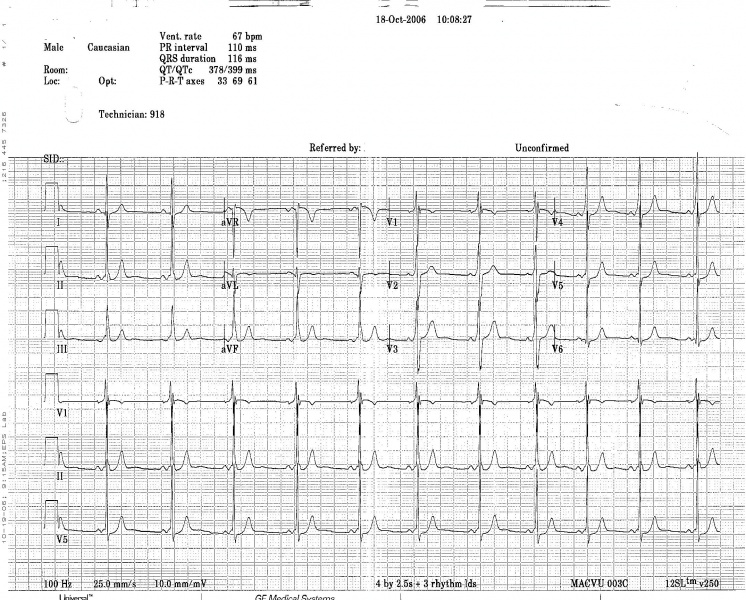
Shown below is an electrocardiogram of Wolff-Parkinson-White syndrome depicting delta wave.

Shown below is an electrocardiogram of Wolff-Parkinson-White syndrome (antero-septal pathway).
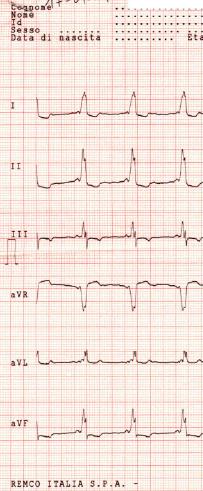
Shown below is an electrocardiogram of Wolff-Parkinson-White syndrome (antero-septal pathway).
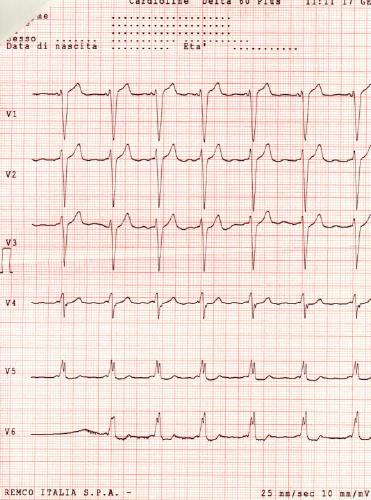
Shown below is an electrocardiogram of Wolff-Parkinson-White syndrome (epicardial pathway).
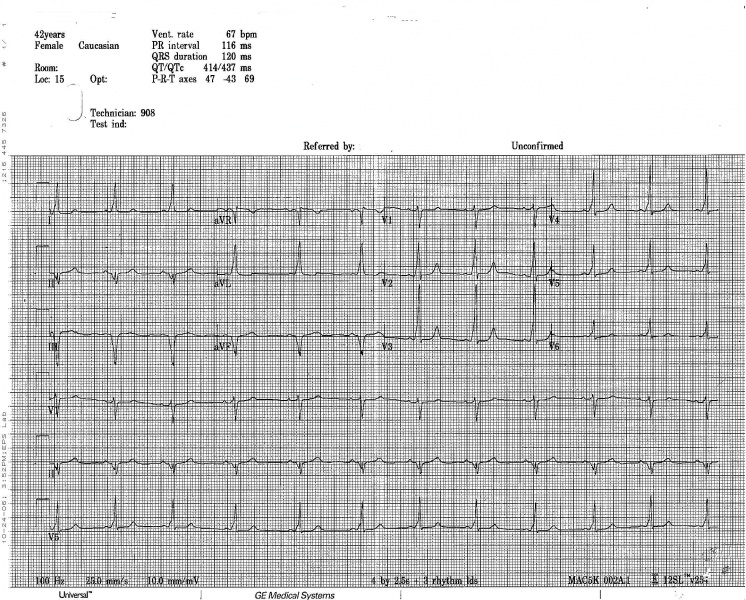
Shown below is an electrocardiogram of Wolff-Parkinson-White syndrome (left posterior pathway).
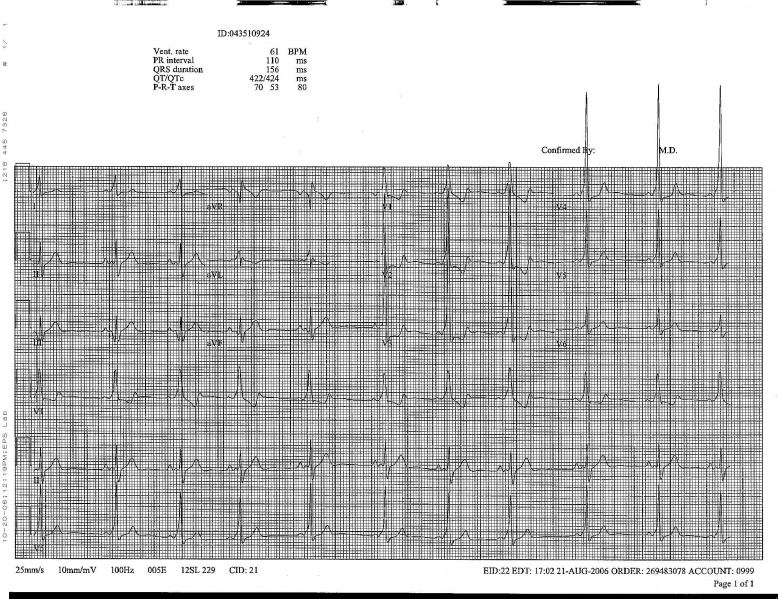
Shown below is an electrocardiogram of Wolff-Parkinson-White syndrome (Posteroseptal pathway).
Shown below is an EKG showing abnormal QRS form with delta waves seen best in the V leads.

Shown below is an electrocardiogram of Wolff-Parkinson-White syndrome demonstrating upstroke of the QRS-complex which is 'slurred', resulting in a delta-wave (arrow).

Shown below is an electrocardiogram of delta waves in a patient with Wolff-Parkinson-White Syndrome (WPW)
Shown below is a 12 lead electrocardiogram of WPW syndrome.
Shown below is a 12 lead electrocardiogram of WPW syndrome.
Shown below is a 12 lead electrocardiogram of WPW syndrome.
Shown below is a 12 lead electrocardiogram of WPW syndrome type I.
Shown below is a 12 lead electrocardiogram of WPW syndrome type I.
Shown below is a 12 lead electrocardiogram of WPW syndrome type I.
Shown below is a 12 lead electrocardiogram of WPW syndrome type II.
Shown below is a 12 lead electrocardiogram of WPW syndrome type II.
Shown below is a 12 lead electrocardiogram of WPW syndrome type II.
Shown below is a 12 lead electrocardiogram of WPW syndrome type II.
Shown below is a 12 lead electrocardiogram of WPW syndrome type II.
WPW syndrome with an orthodromic circus movement tachycardia: Narrow complex tachycardia with a rate of 200 bpm (RR interval 320 ms). After 5 cycles, the tachycardia suddenly stops and four multiform complexes are seen without any P waves. These complexes should be regarded as a polymorphic ventricular tachycardia, which is not uncommon after an adenosine-terminated supraventricular tachycardia. A 5th complex is preceded by a P wave. The subsequent 4 complexes show a widened QRS complex and all are immediately preceded by a P wave. The initial phase of the QRS complex is slurred and positive in all available leads. Sinus rhythm continues thereafter with gradual abbreviation of the QRS complex until a 120 msec wide QRS complex remains.
The same patient's EKG during sinus rhythm. A discrete delta wave is clearly visible. The morphology of the delta wave suggests a left posterior Kent bundle.
The recording below shows sinus rhythm. The remarkable finding is the short PR interval (<120 ms) and the slurred upstroke of the QRS. This is best seen in leads I and aVL, V2 to V6. Of interest is that the delta wave is negative in the inferior leads and gives the false impression of an inferior wall myocardial infarction. This tracing show WPW ventricular pre-excitation.
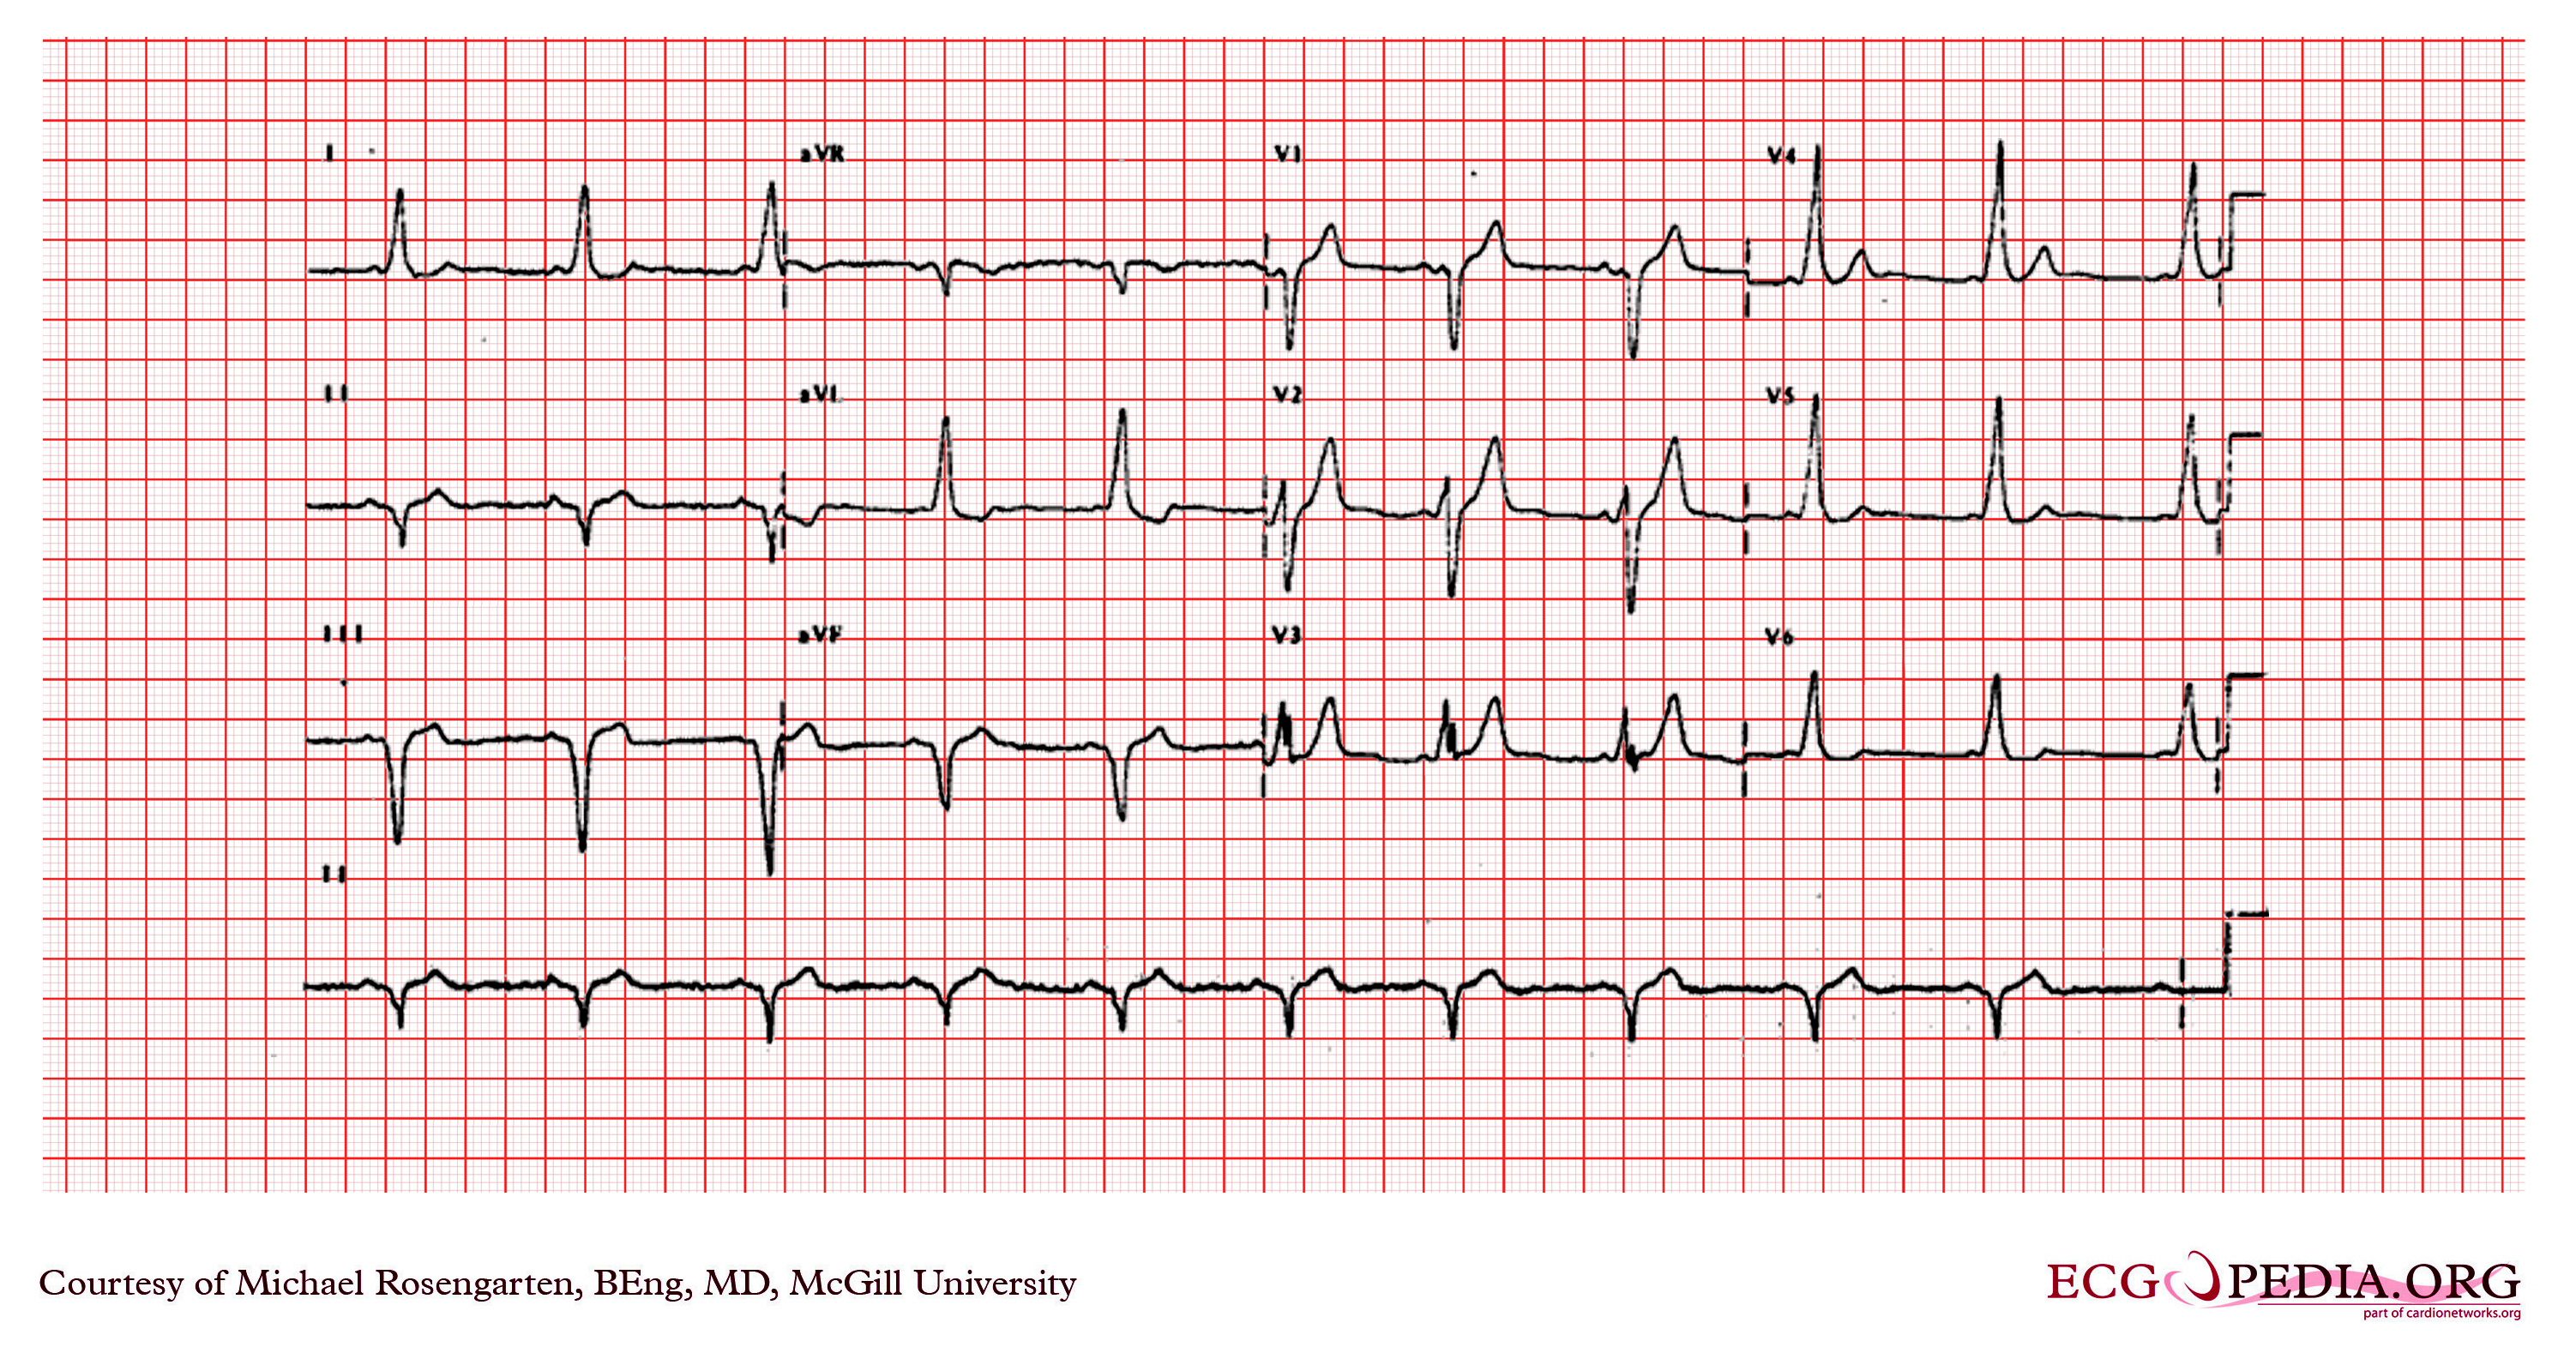
Shown below is an example of an ECG showing a slurred upstroke of QRS complex which is best appreciated in the precordial leads and a PR interval of less than 120 ms.

Shown below is an example of an ECG demonstrating a delta wave in lead V2 along with left axis deviation.

Sources
Copyleft images obtained courtesy of ECGpedia, http://en.ecgpedia.org/index.php?title=Special:NewFiles&offset=&limit=500