Ventricular tachycardia electrocardiogram: Difference between revisions
| Line 67: | Line 67: | ||
===EKG Examples=== | ===EKG Examples=== | ||
Shown below is an [[EKG]] with a rapid ventricular rate of nearly 190 beats per minute with [[wide QRS complex]] in all leads depicting ventricular tachycardia. | |||
[[Image:Ganseman.VT1.jpg|center|800px]] | |||
Copyleft image obtained courtesy of ECGpedia,http://en.ecgpedia.org/wiki/Main_Page | |||
---- | ---- | ||
Shown below is an EKG with a rapid ventricular rate of nearly 150 beats per minute with [[wide QRS complex]] in all leads depicting ventricular tachycardia. | |||
[[Image:Ganseman.VT2.jpg|center|800px]] | |||
Copyleft image obtained courtesy of ECGpedia,http://en.ecgpedia.org/wiki/Main_Page | |||
---- | |||
Shown below is an EKG with a rapid ventricular rate of nearly 250 beats per minute with [[wide QRS complex]]es in all leads depicting ventricular tachycardia. | |||
[[Image:Ganseman.VT3.jpg|center|800px]] | |||
Copyleft image obtained courtesy of ECGpedia,http://en.ecgpedia.org/wiki/Main_Page | |||
---- | |||
Shown below is an EKG with a rapid ventricular rate of nearly 215 beats per minute with [[wide QRS complex]]es in all leads depicting ventricular tachycardia. | |||
[[Image:Ganseman.VT6.jpg|center|800px]] | |||
Copyleft image obtained courtesy of ECGpedia,http://en.ecgpedia.org/wiki/Main_Page | |||
---- | |||
Shown below is an EKG with a rapid ventricular rate of nearly 140 bpm with a [[LBBB|left bundle branch block]] pattern and left heart axis. | |||
[[Image:12lead_vt1.jpg|center|800px]] | |||
Copyleft image obtained courtesy of ECGpedia,http://en.ecgpedia.org/wiki/Main_Page | |||
---- | |||
Shown below is an EKG depicting ventricular tachycardia with a rate of 250 bpm, and a [[right bundle branch block]] pattern with a right [[heart axis]]. | |||
[[Image:12lead_vt2.png|center|800px]] | |||
Copyleft image obtained courtesy of ECGpedia,http://en.ecgpedia.org/wiki/Main_Page | |||
---- | |||
Shown below is an EKG depicting ventricular tachycardia with a rate of 150 bpm, and a [[right bundle branch block]] pattern with right [[heart axis]]. The 5th and 6th complexes from the right side are fusion complexes. Furthermore this EKG shows [[baseline drift]], which is a technical artefact | |||
[[Image:12lead_vt3.png|center|800px]] | |||
Copyleft image obtained courtesy of ECGpedia,http://en.ecgpedia.org/wiki/Main_Page | |||
---- | |||
Shown below is an EKG depicting a non sustained VT of five beats duration. | |||
[[Image:Ventricular Tachycardia 2.png|center|800px]] | |||
Copyleft image obtained courtesy of ECGpedia,http://en.ecgpedia.org/wiki/File:De-Nsvt.png | |||
---- | |||
Shown below is an EKG depicting ventricular tachycardia at a rate of 145 beats per minute with a [[right bundle branch block]] pattern and left [[heart axis]]. | |||
[[Image:Ventricular Tachycardia 1.jpg|center|800px]] | |||
Copyleft image obtained courtesy of ECGpedia,http://en.ecgpedia.org/wiki/File:De-12lead_vt4.jpg | |||
---- | |||
Shown below is an EKG depicting biphasic ventricular tachycardia in a patient with [[long QT syndrome]]. | |||
[[Image:Ventricular Tachycardia 3.jpg|center|800px]] | |||
Copyleft image obtained courtesy of ECGpedia,http://en.ecgpedia.org/wiki/File:De-DVA2161.jpg | |||
---- | |||
Shown below is and EKG in a person with idiopathic ventricular tachycardia (Belhassen VT). | |||
[[Image:Ventricular Tachycardia 4.jpg|center|800px]] | |||
Copyleft image obtained courtesy of ECGpedia,http://en.ecgpedia.org/wiki/File:De-ECG000006.jpg | |||
---- | |||
Shown below is an EKG with a rapid ventricular rate of about 170/min with [[wide QRS complexes]] in lead [[Electrocardiogram#Limb|II]] depicting ventricular tachycardia. | Shown below is an EKG with a rapid ventricular rate of about 170/min with [[wide QRS complexes]] in lead [[Electrocardiogram#Limb|II]] depicting ventricular tachycardia. | ||
[[Image:Lead II rhythm ventricular tachycardia Vtach VT.jpg|500px|center]] | [[Image:Lead II rhythm ventricular tachycardia Vtach VT.jpg|500px|center]] | ||
Revision as of 00:10, 12 January 2020
|
Ventricular tachycardia Microchapters |
|
Differentiating Ventricular Tachycardia from other Disorders |
|---|
|
Diagnosis |
|
Treatment |
|
Case Studies |
|
Ventricular tachycardia electrocardiogram On the Web |
|
to Hospitals Treating Ventricular tachycardia electrocardiogram |
|
Risk calculators and risk factors for Ventricular tachycardia electrocardiogram |
Editor-In-Chief: C. Michael Gibson, M.S., M.D. [1]; Associate Editor-in Chief: Avirup Guha, M.B.B.S.[2]; Priyamvada Singh, M.D. [3]
Overview
The diagnosis of ventricular tachycardia almost completely depends on EKG findings. The details are illustrated below. It is important to differentiate it from other wide complex tachycardias. The rate is > 100 beats per minute, and is usually 150-200 beats per minute. The QRS complex is wide (>140 milliseconds). AV dissociation is always present, but is evident in only 20% of cases of VT.
Electrocardiogram
Brugada Criteria
- The Brugada criteria is the most common algorithm used to diagnose ventricular tachycardia.
- In Brugada's algorithm, four criteria for VT are sequentially assessed.
- If any one of the four criteria are fulfilled, a diagnosis of VT is made.
- If none of the criteria are fulfilled, a diagnosis of SVT is made.
- The four criteria are as follows:
- Check for concordance in the precordial leads. Concordance is said to be present when the QRS complexes in all the leads V1 to V6 are monophasic (all positive or all negative) with the same polarity. If any of the precordial leads has a biphasic QRS concordance is absent.
- If the longest RS interval in any lead is >100 msec and R wave is wider than S wave a diagnosis of VT can be made.
- If longest RS interval is less than 100 msec, presence of AV dissociation can lead to a diagnosis of VT.
- If longest RS interval is less than 100 msec, and AV dissociation is not present then the QRS morphology is used to make the diagnosis. QRS morphology criteria consistent with VT must be present in leads V1 or V2 and in lead V6. A VT with RBBB morphology is here when the QRS polarity in lead V1 and V2 are poisitive whereas, a LBBB pattern occurs with a negative QRS polarity. If either the V1-V2 or the V6 criteria are not consistent with VT, an diagnosis of SVT is made.
Diagnostic Electrocardiographic Findings
- Abnormal and wide QRS complexes with secondary ST segment and T wave changes.
- Usual QRS duration is > 0.12 seconds, may be shorter if the ectopic focus is located in the ventricular septum.
- The secondary ST segment and T wave changes are in a direction that is opposite the major deflection of the QRS.
- A ventricular rate between 140 and 200 BPM.
- When the rate is >200 and has a sine wave appearance, it is called ventricular flutter.
- When the rate is <110 BPM it is called non-paroxysmal VT.
- A regular or slightly irregular (up to 0.03 seconds) rhythm.
- Abrupt onset and termination.
- AV dissociation
- Atrial rate slower than ventricular rate.
- No relationship between atrial activity and ventricular activity.
- There can be VA conduction.
- The RP interval is >0.11 seconds.
- Occurs in about 50% of cases.
- Uncommon when the ventricular rate is rapid (only 1/7 when the rate was>200).
- Axis
- Northwest quadrant is almost always VT in adults.
- In someone with a normal QRS in sinus rhythm, a LBBB-like wide complex tachycardia with a right axis (+90 to +180) is always VT because activation in LBBB aberration always goes from right to left.
- Concordance
- If all the precordial leads are positive (R) or negative (QS) the rhythm is very likely VT.
- V1-V2 morphology
- V6 morphology
- RBBB morphology - QS or rS favors VT. Although this can be influenced by axis (it is almost always seen in VT with left axis deviation, but is seen in only approximately 50% of VT with a normal axis, even in the same patient).
- LBBB morphology - a qR or QS is highly predictive of VT.
- Capture beats
- Occurs when a supraventricular impulse is conducted and captures the ventricle.
- They are rare.
- Fusion beats
Ventricular Tachycardia
- Ventricular tachycardia originates from a ventricular focus.
- Lasts more than 30 seconds.
- Broad QRS complexes: rate of >90 BPM.
Paroxysmal Ventricular Tachycardia
- Rapid succession of three or more ectopic beats.
- Sustained if it lasts longer than 30 seconds.
- Called incessant if the tachycardia is recurrent and the episodes are interrupted by only a few sinus beats.
EKG Examples
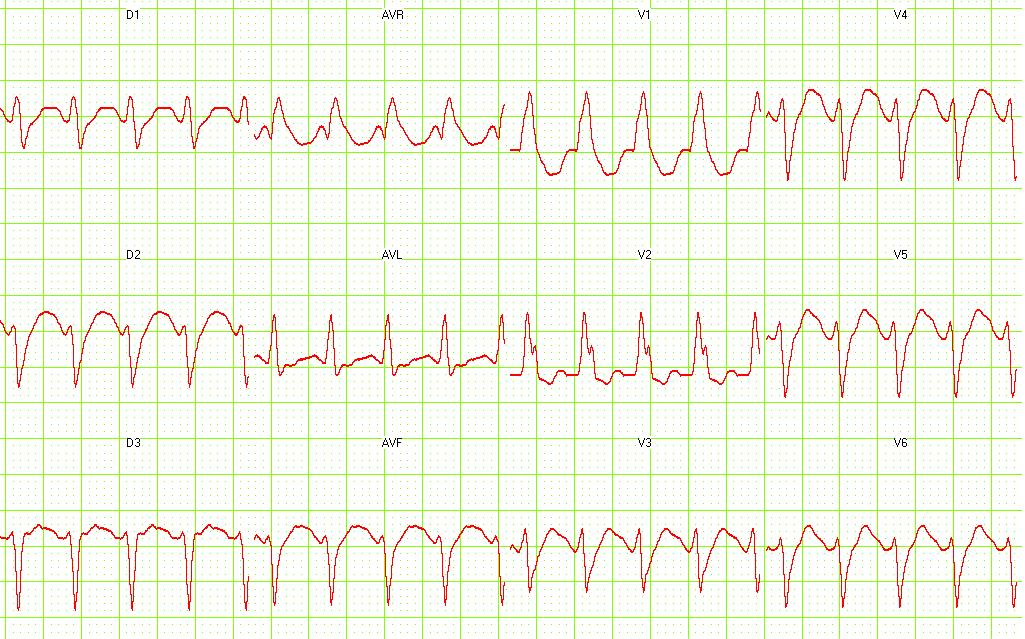
Shown below is an EKG with a rapid ventricular rate of nearly 190 beats per minute with wide QRS complex in all leads depicting ventricular tachycardia.
Copyleft image obtained courtesy of ECGpedia,http://en.ecgpedia.org/wiki/Main_Page
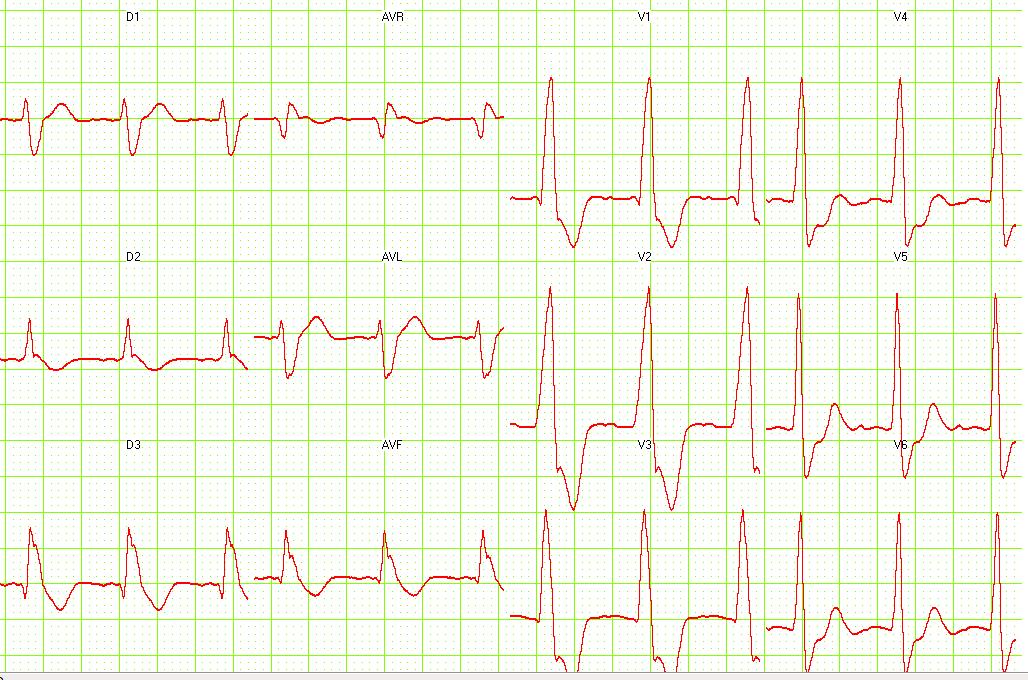
Shown below is an EKG with a rapid ventricular rate of nearly 150 beats per minute with wide QRS complex in all leads depicting ventricular tachycardia.
Copyleft image obtained courtesy of ECGpedia,http://en.ecgpedia.org/wiki/Main_Page
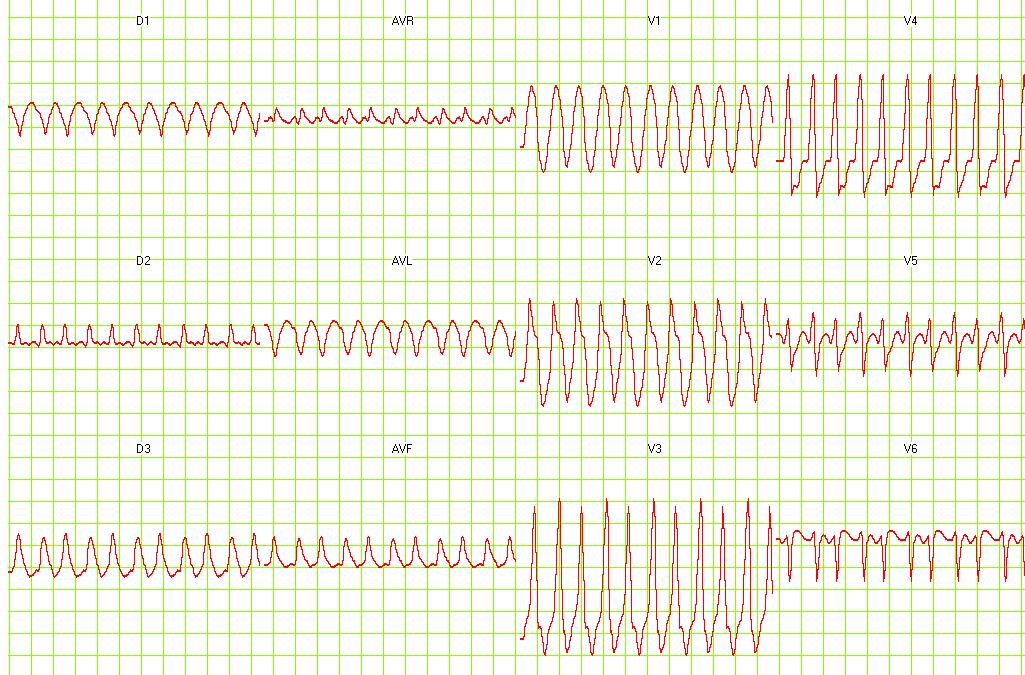
Shown below is an EKG with a rapid ventricular rate of nearly 250 beats per minute with wide QRS complexes in all leads depicting ventricular tachycardia.
Copyleft image obtained courtesy of ECGpedia,http://en.ecgpedia.org/wiki/Main_Page
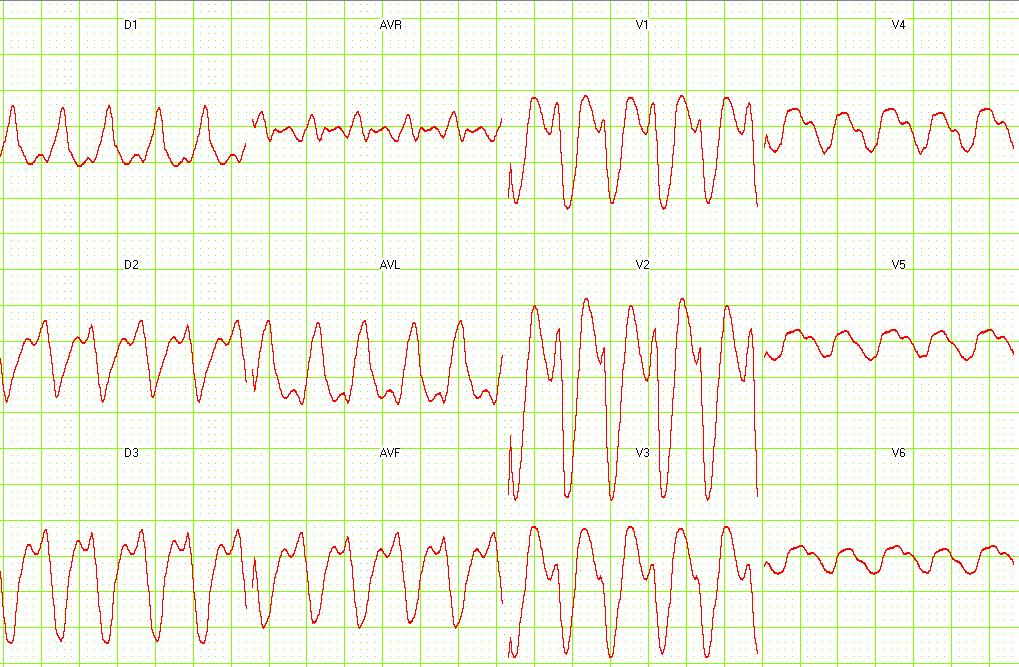
Shown below is an EKG with a rapid ventricular rate of nearly 215 beats per minute with wide QRS complexes in all leads depicting ventricular tachycardia.
Copyleft image obtained courtesy of ECGpedia,http://en.ecgpedia.org/wiki/Main_Page
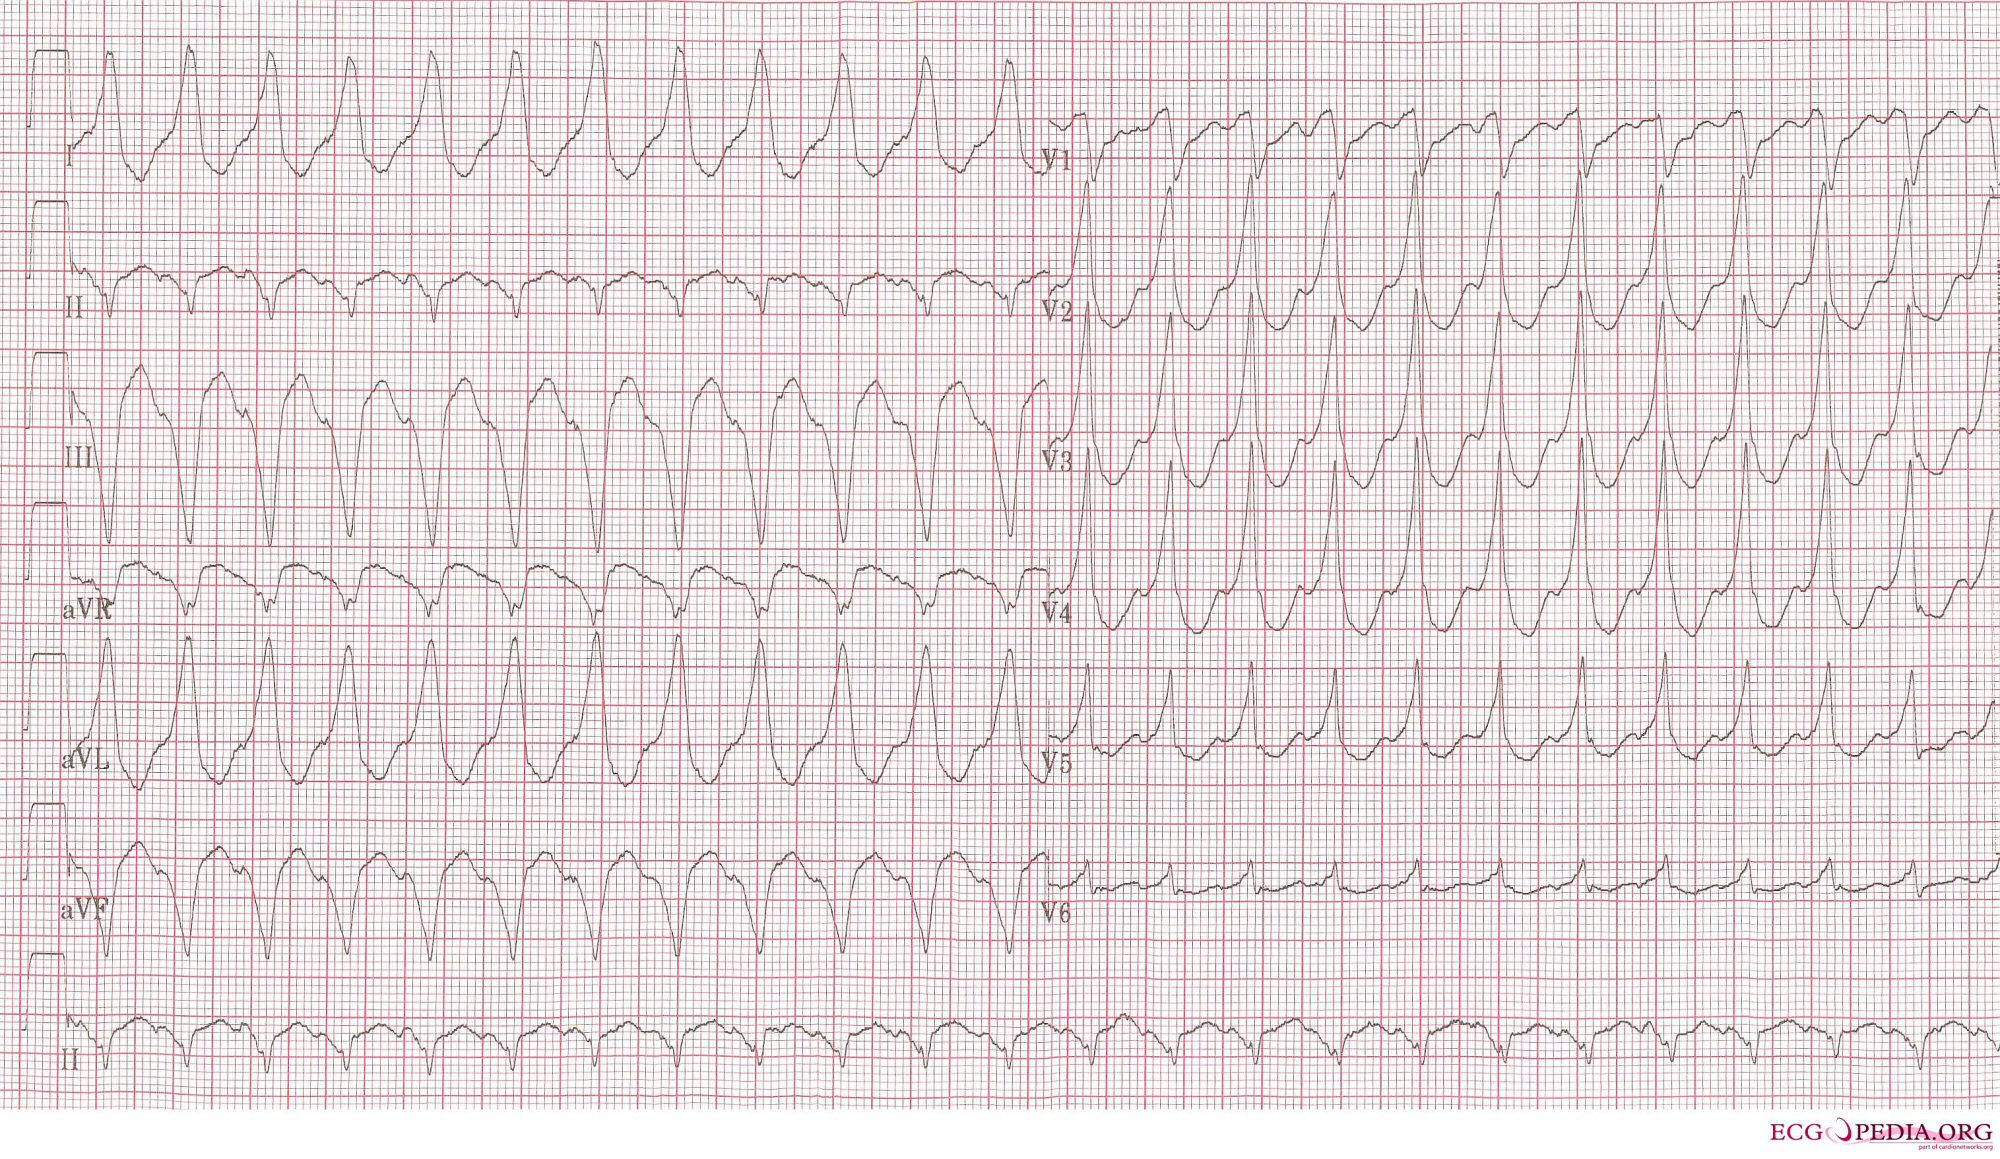
Shown below is an EKG with a rapid ventricular rate of nearly 140 bpm with a left bundle branch block pattern and left heart axis.
Copyleft image obtained courtesy of ECGpedia,http://en.ecgpedia.org/wiki/Main_Page
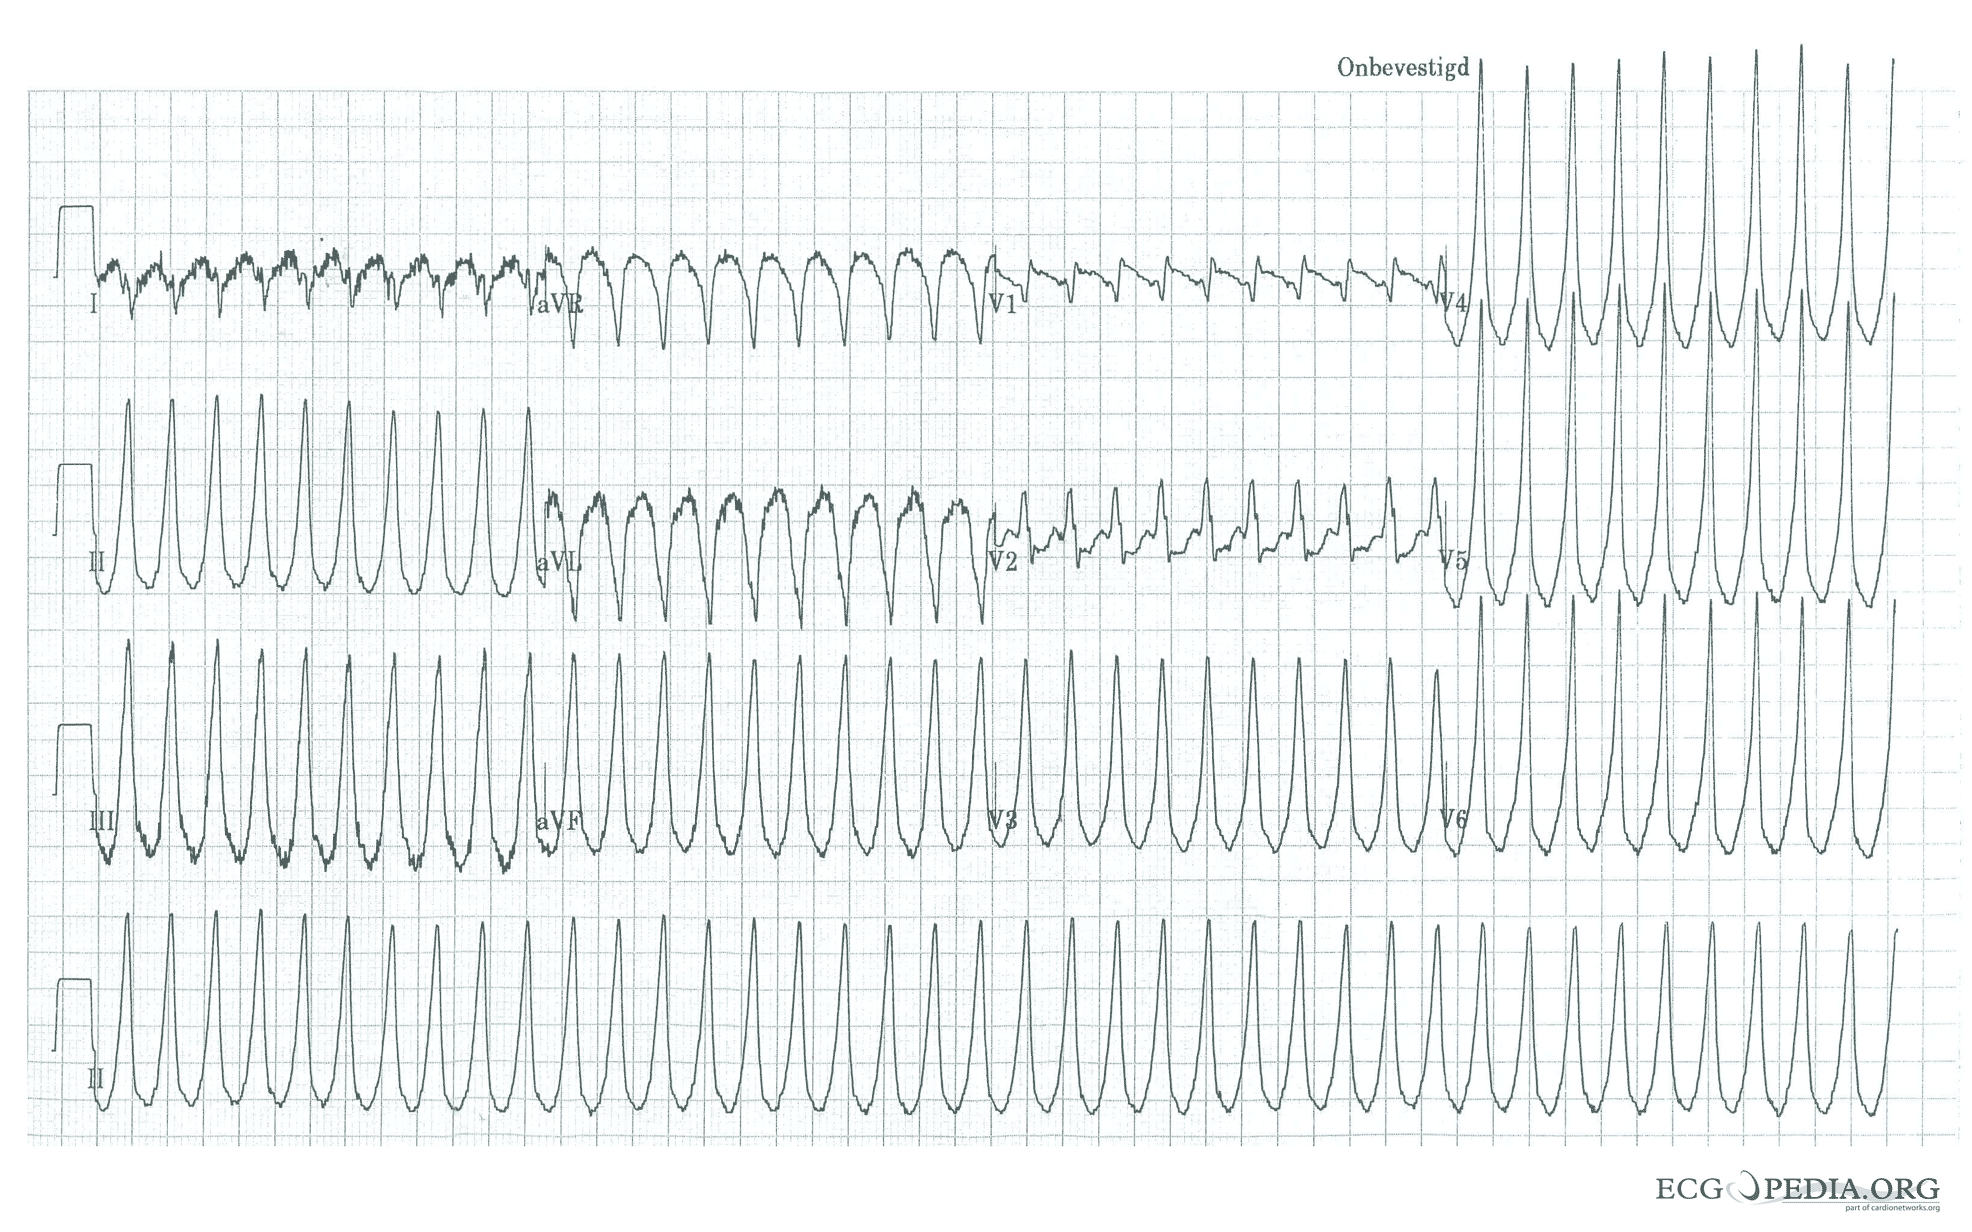
Shown below is an EKG depicting ventricular tachycardia with a rate of 250 bpm, and a right bundle branch block pattern with a right heart axis.
Copyleft image obtained courtesy of ECGpedia,http://en.ecgpedia.org/wiki/Main_Page
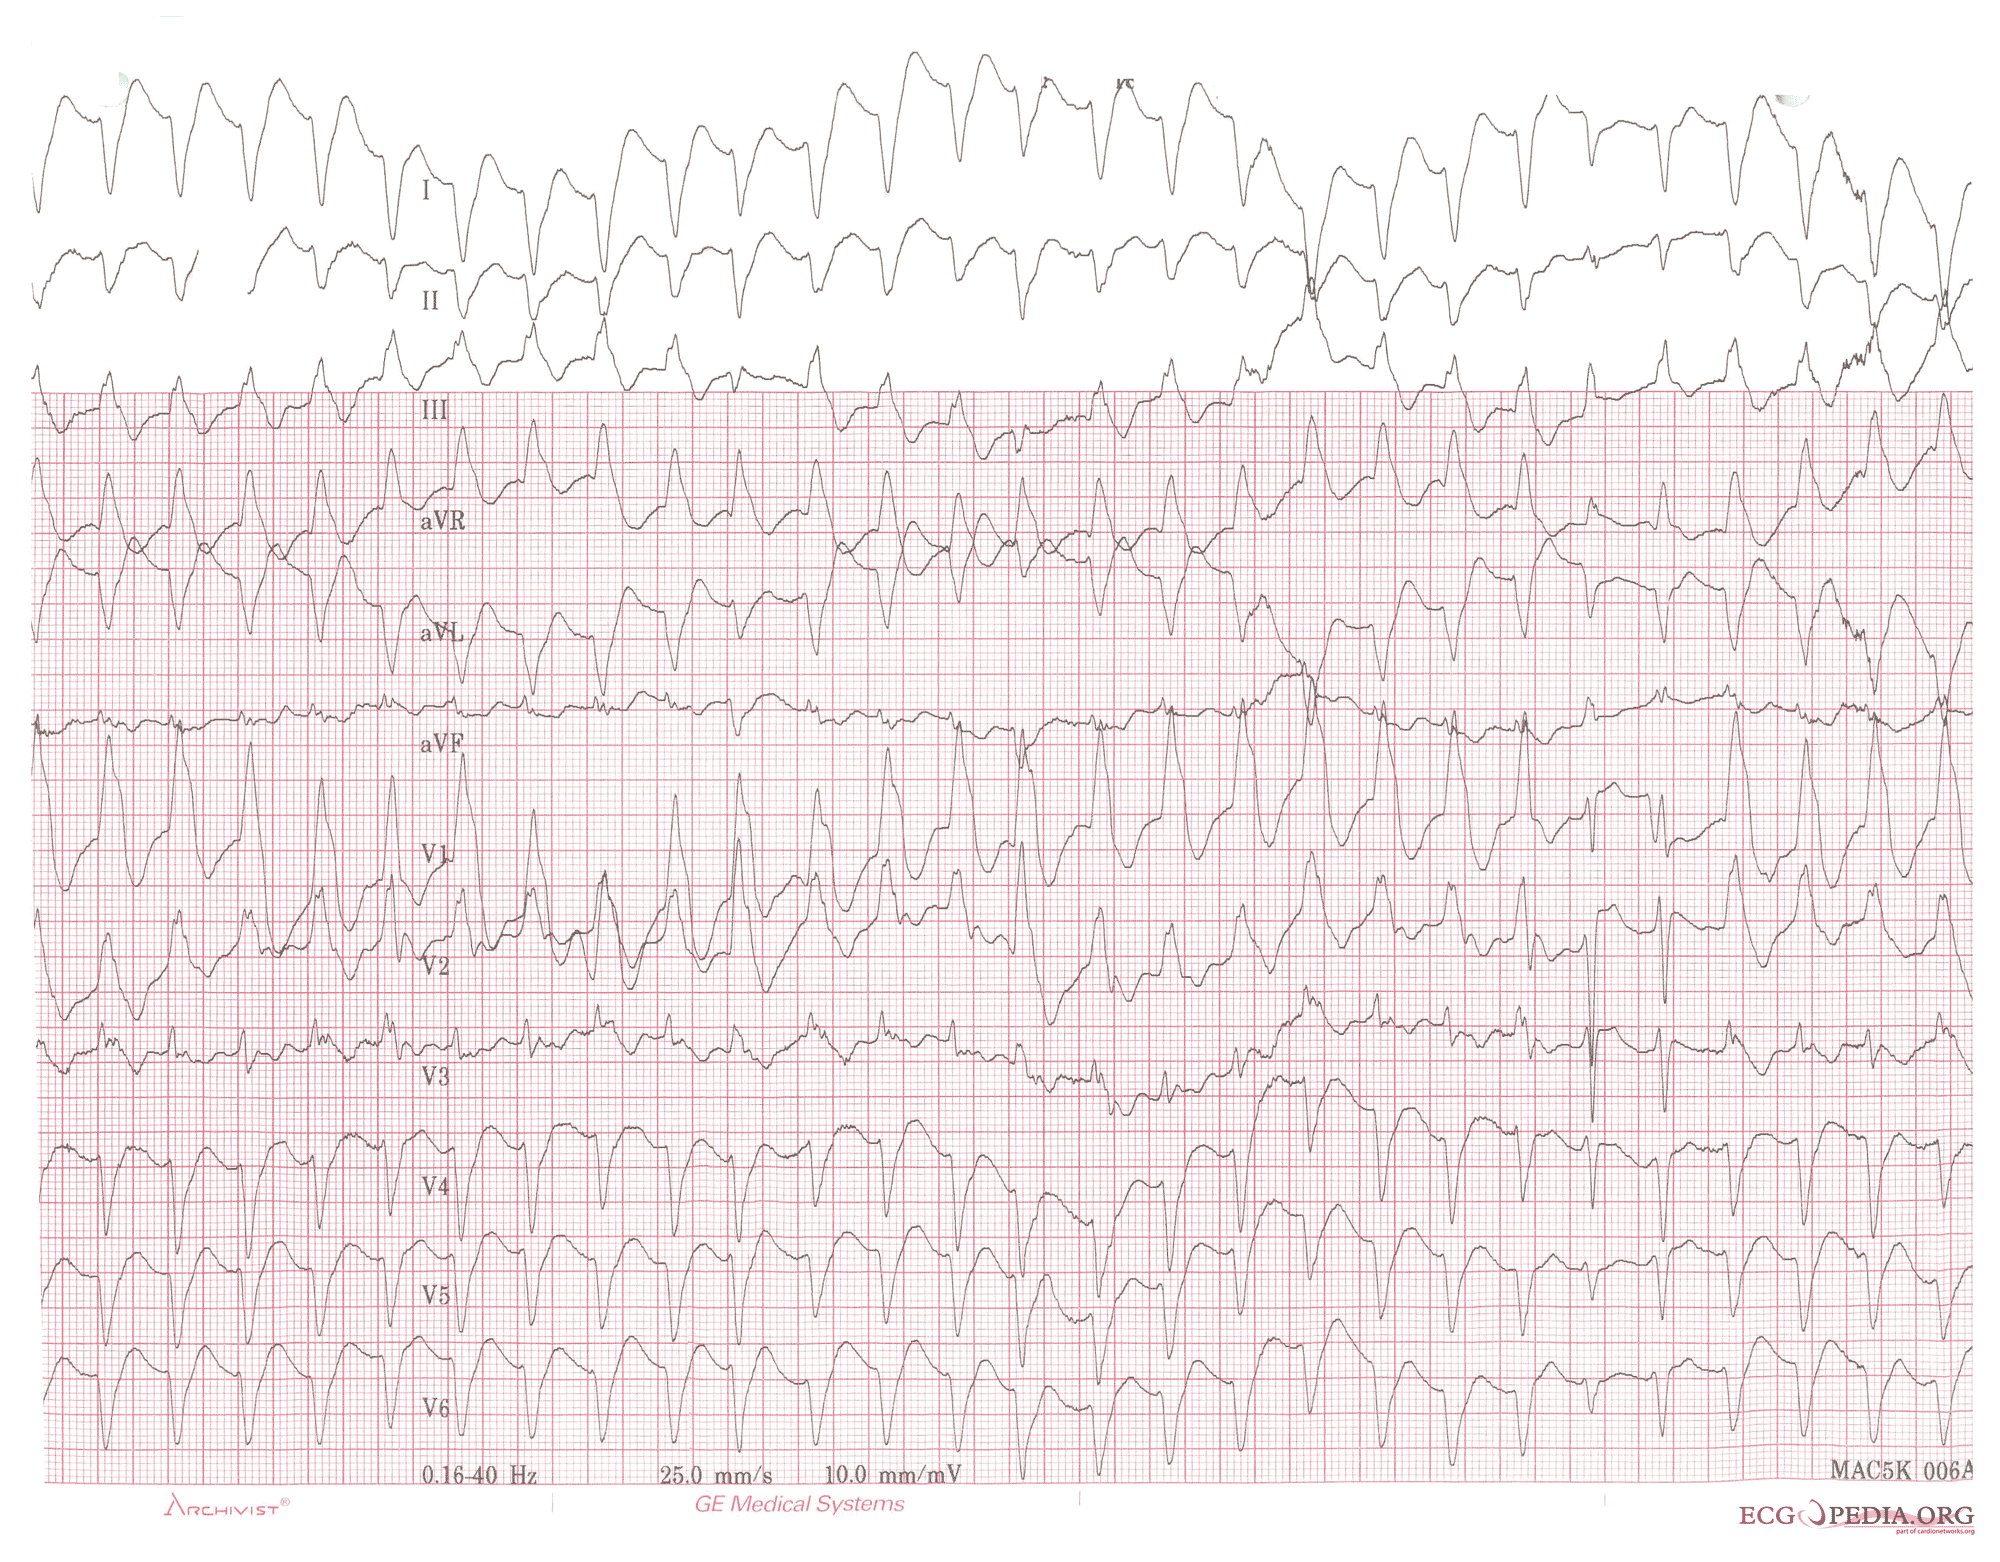
Shown below is an EKG depicting ventricular tachycardia with a rate of 150 bpm, and a right bundle branch block pattern with right heart axis. The 5th and 6th complexes from the right side are fusion complexes. Furthermore this EKG shows baseline drift, which is a technical artefact
Copyleft image obtained courtesy of ECGpedia,http://en.ecgpedia.org/wiki/Main_Page
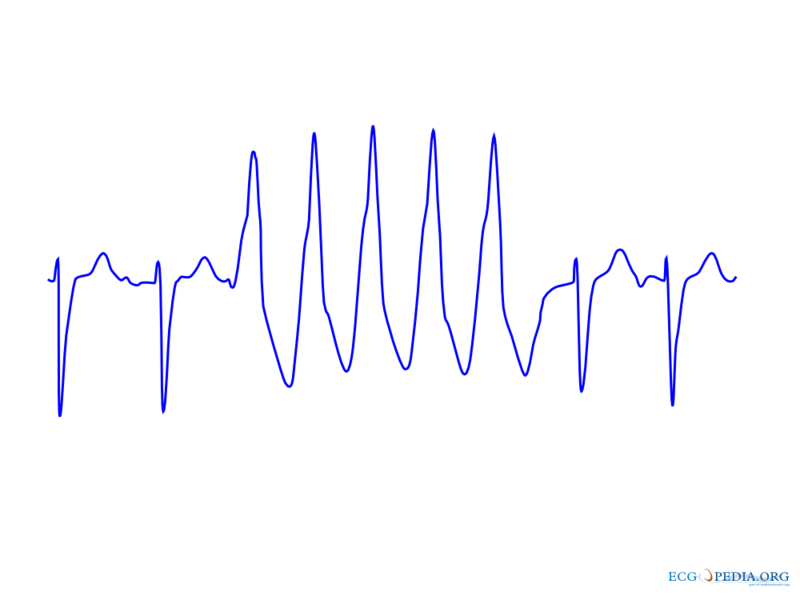
Shown below is an EKG depicting a non sustained VT of five beats duration.
Copyleft image obtained courtesy of ECGpedia,http://en.ecgpedia.org/wiki/File:De-Nsvt.png
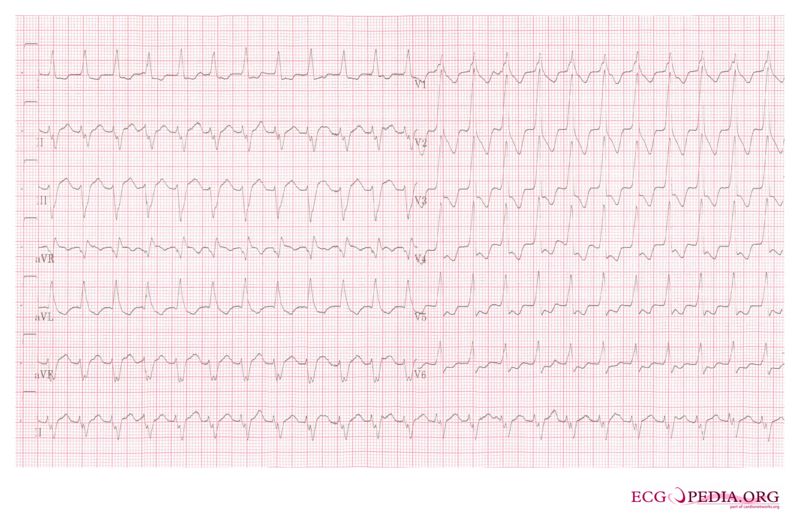
Shown below is an EKG depicting ventricular tachycardia at a rate of 145 beats per minute with a right bundle branch block pattern and left heart axis.
Copyleft image obtained courtesy of ECGpedia,http://en.ecgpedia.org/wiki/File:De-12lead_vt4.jpg
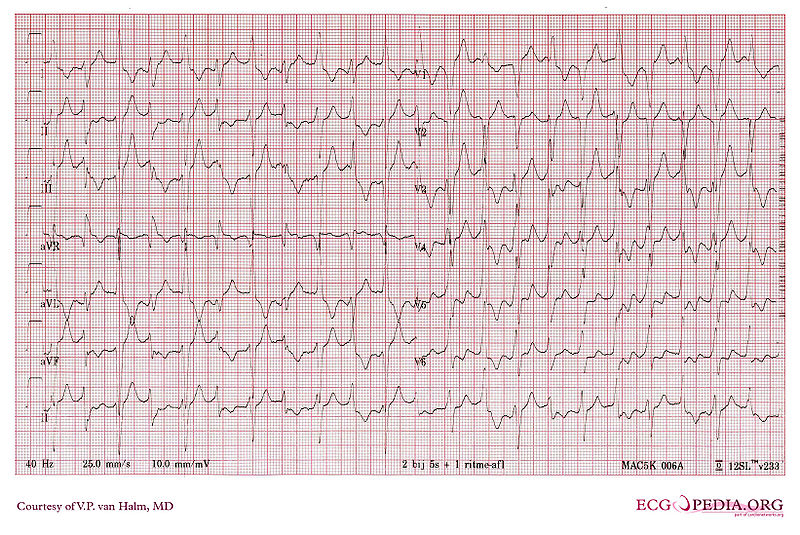
Shown below is an EKG depicting biphasic ventricular tachycardia in a patient with long QT syndrome.
Copyleft image obtained courtesy of ECGpedia,http://en.ecgpedia.org/wiki/File:De-DVA2161.jpg
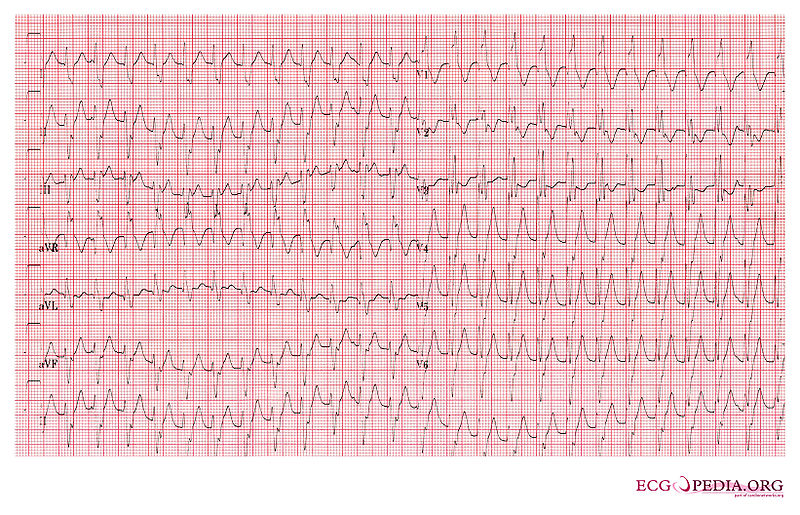
Shown below is and EKG in a person with idiopathic ventricular tachycardia (Belhassen VT).
Copyleft image obtained courtesy of ECGpedia,http://en.ecgpedia.org/wiki/File:De-ECG000006.jpg
Shown below is an EKG with a rapid ventricular rate of about 170/min with wide QRS complexes in lead II depicting ventricular tachycardia.

Copyleft image obtained courtesy of ECGpedia, http://en.ecgpedia.org/wiki/Main_Page
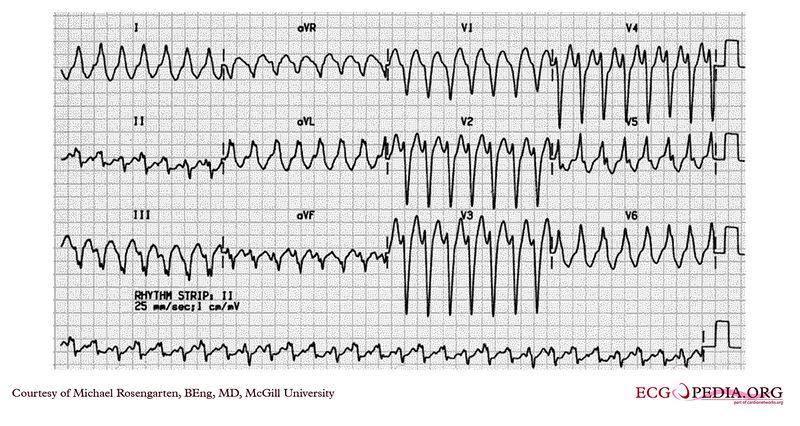
Shown below is an EKG depicting a wide complex tachycardia with a left bundle branch morphology at a rate of about 160/min. The R wave in lead V2 is broad, and the time from the beginning of the QRS in lead V2 to the peak of the S wave is longer than 80 ms. No P wave activity is clearly seen. This EKG suggests ventricular tachycardia.
Copyleft image obtained courtesy of ECGpedia,http://en.ecgpedia.org/wiki/File:E334.jpg
Shown below is an EKG with a rapid ventricular rate of nearly 190 beats per minute with wide QRS complexes depicting ventricular tachycardia.
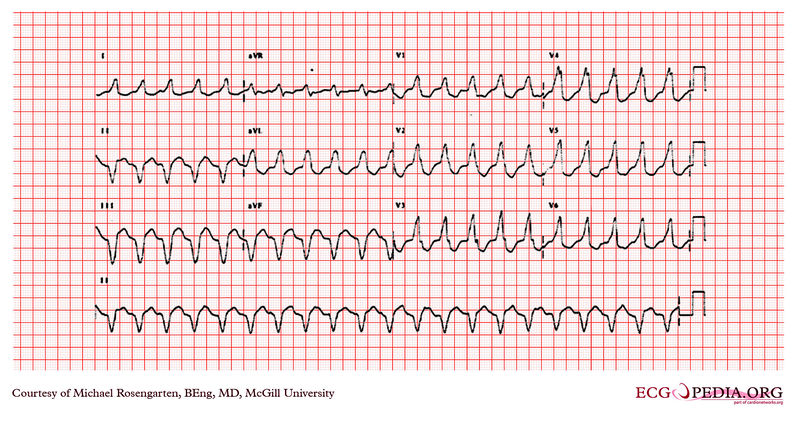
Copyleft image obtained courtesy of ECGpedia,http://en.ecgpedia.org/wiki/File:E253.jpg
Shown below is an EKG with a rapid ventricular rate of about 190/min with wide QRS complex in all leads depicting ventricular tachycardia.
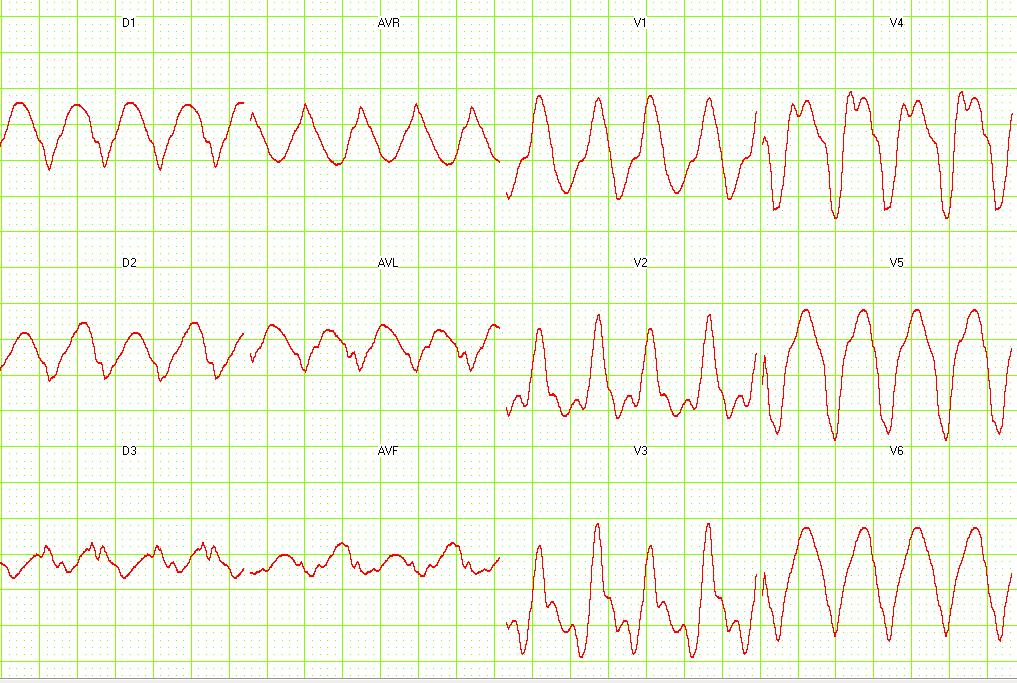
Copyleft image obtained courtesy of ECGpedia, http://en.ecgpedia.org/wiki/Main_Page
For more EKG examples of ventricular tachycardia, click here.
References
- ↑ Chou's Electrocardiography in Clinical Practice Third Edition, pp. 398-409.
- ↑ Sailer, Christian, Wasner, Susanne. Differential Diagnosis Pocket. Hermosa Beach, CA: Borm Bruckmeir Publishing LLC, 2002:194 ISBN 1591032016
- ↑ Hammill S. C. Electrocardiographic diagnoses: Criteria and definitions of abnormalities, Chapter 18, MAYO Clinic, Concise Textbook of Cardiology, 3rd edition, 2007 ISBN 0-8493-9057-5