Hepatocellular adenoma MRI
|
Hepatocellular adenoma Microchapters |
|
Diagnosis |
|---|
|
Treatment |
|
Case Studies |
|
Hepatocellular adenoma MRI On the Web |
|
American Roentgen Ray Society Images of Hepatocellular adenoma MRI |
|
Risk calculators and risk factors for Hepatocellular adenoma MRI |
Editor-In-Chief: C. Michael Gibson, M.S., M.D. [1]; Associate Editor(s)-In-Chief: Cafer Zorkun, M.D., Ph.D. [2]Nawal Muazam M.D.[3]
Overview
MRI
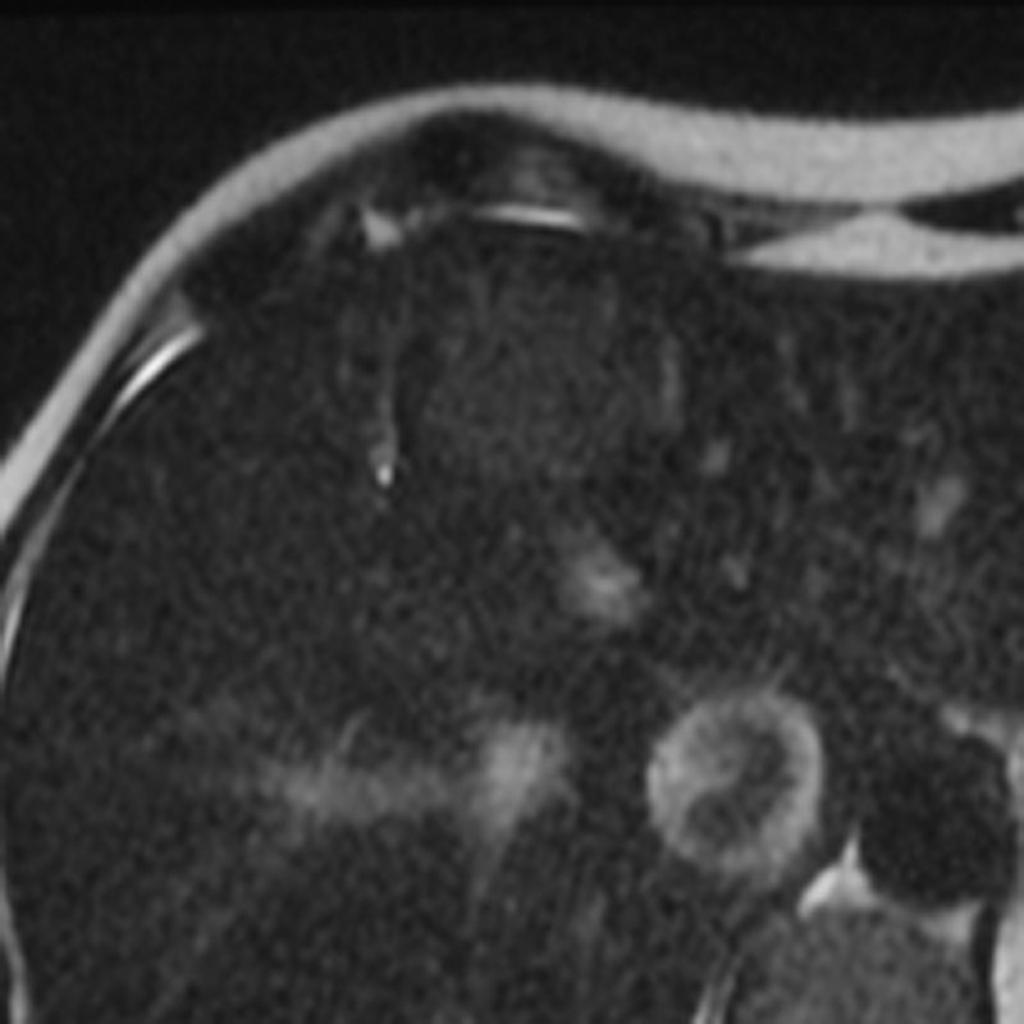
- On T1-weighted MR images, hepatocellular adenomas have been variously described as hyperintense, isointense, and hypointense lesions.
- It has been reported that 47%–74% of hepatocellular adenomas are predominantly hyperintense relative to liver on T2-weighted images; this is due to prolonged T2 and is consistent with findings in other hepatic tumors.
- Some lesions are hypointense and isointense on T2-weighted images.
- Most lesions are heterogeneous, demonstrating a combination of hyper- and hypointensity on T2-weighted images relative to hemorrhage and necrosis.
- Dynamic gadolinium-enhanced gradient-echo MR imaging, like dynamic CT, can be used to demonstrate early arterial enhancement that reflects the presence of subcapsular feeding vessels.
- Adenomas usually do not show uptake of superparamagnetic iron oxide particles, resulting in decreased signal intensity on T2-weighted images.
- After injection of a hepatocellular-specific contrast agent such as gadolinium benzyloxypropionictetraacetate (Gd-BOPTA) there is usually no substantial uptake.
-
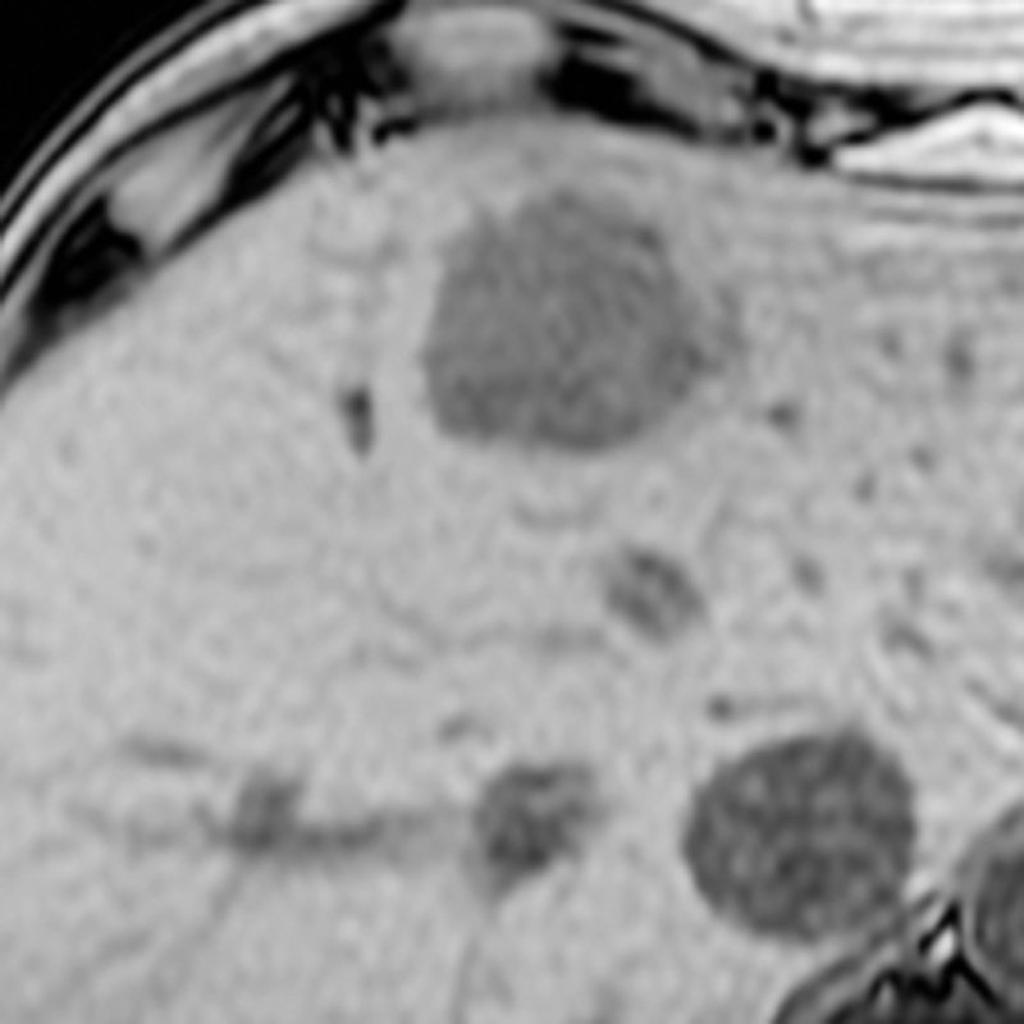
liver MRI show a large, subtle T2 hyperintense, well defined rounded lesion in the liver which demonstrates homogenous signal loss on T1 opposed phase scans.
-