Hamartoma CT
|
Hamartoma Microchapters |
|
Diagnosis |
|---|
|
Treatment |
|
Case Studies |
|
Hamartoma CT On the Web |
|
American Roentgen Ray Society Images of Hamartoma CT |
Editor-In-Chief: C. Michael Gibson, M.S., M.D. [1]Associate Editor(s)-in-Chief: Maria Fernanda Villarreal, M.D. [2]
Overview
CT scan is the imaging modality of choice for the diagnosis of hamartoma. On CT scan, hamartoma is characterized by focal collections of fat, a lesion with a smooth edge, and collections of fat alternating with foci of calcification.[1][2]
CT
- Isodense or hypodense solid masses
- Heterogeneous contrast enhancement relative to adjacent normal parenchyma
- Presence of fat in a well circumscribed solitary pulmonary nodule which does not demonstrate significant growth
- The fat components may be localized or generalized within the nodule and will typically have a Haunsfield measurement of -40 to -120 HU
- Calcification is typically dispersed in the form of multiple clumps throughout the lesion in a popcorn configuration
- On computed tomography, spleen hamartoma findings, include:[3]
- Isodense or hypodense solid masses
- Heterogeneous contrast enhancement relative to adjacent normal parenchyma
- On computed tomography, common findings of renal hamartoma, include:[4]
- Lesions involve the cortex and demonstrate macroscopic fat (less than -20 HU)
- Small renal hamartomas volume averaging may make differentiation from a small cyst difficult
- Renal hamartomas are fat-poor
- Calcification is rare
- On computed tomography, common findings of hypothalamic hamartoma, include:[5]
- Iso-attenuating nodule of soft-tissue
- Calcification is rare
- There is no contrast enhancement
Gallery
-
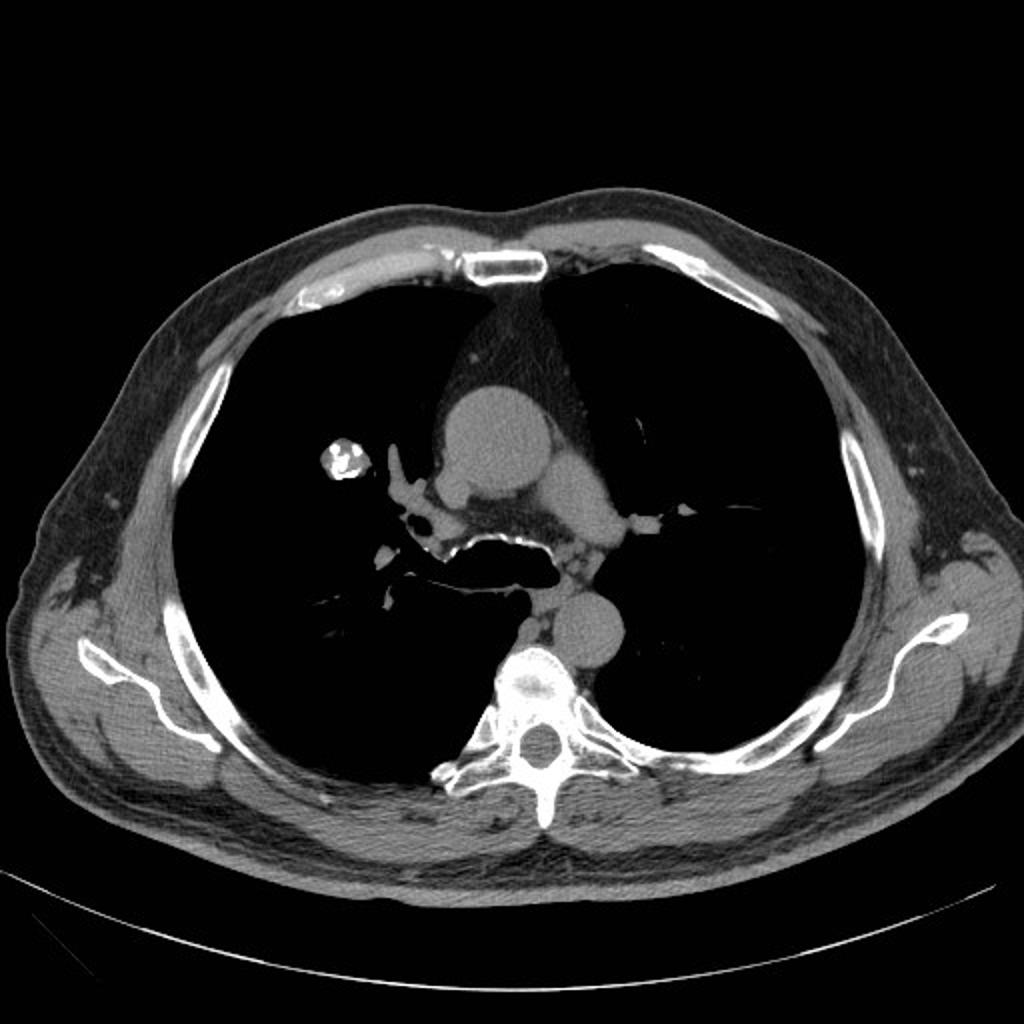
CT scan (CT) shows a well circumcised lesion, with intralesional fat and calcification "popcorn-like appearance" adjacent to the hilum.
-
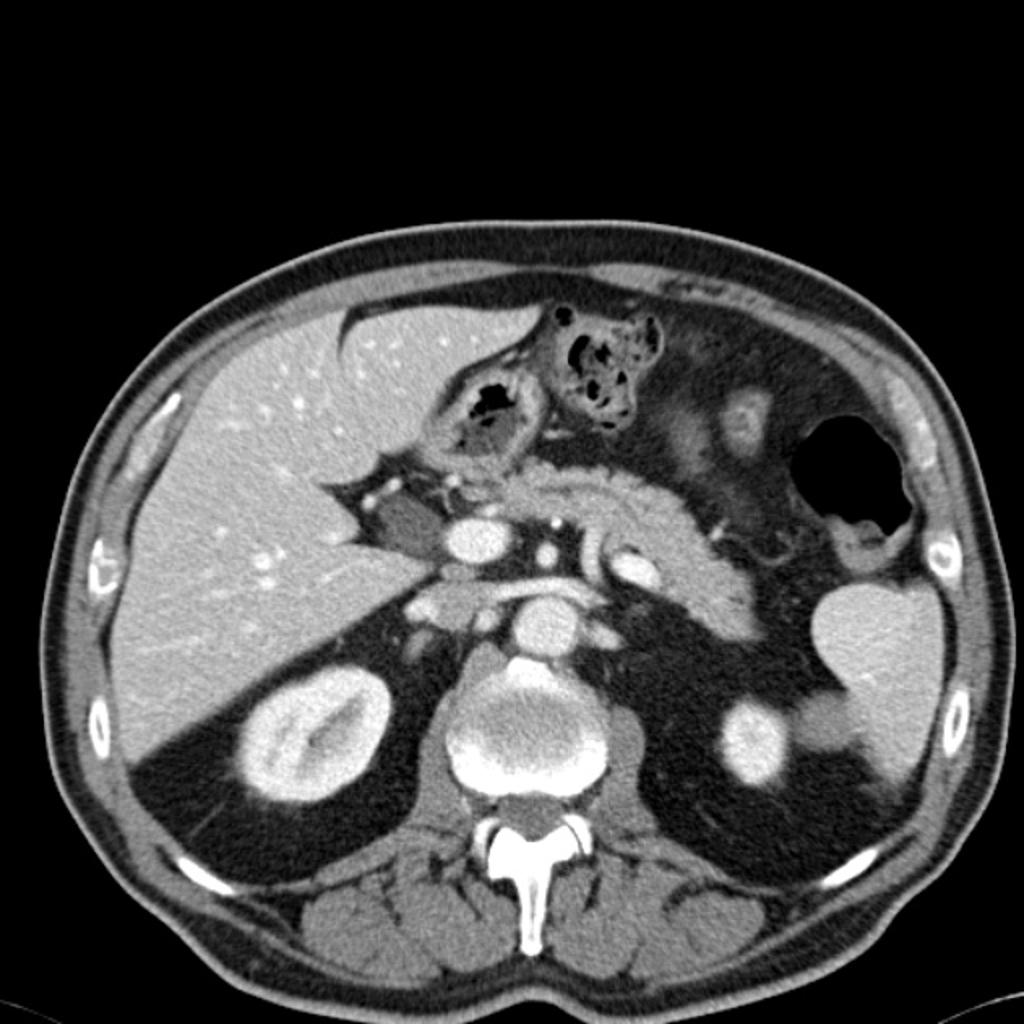
CT scan (CT) shows an isodense solid mass in the inferior pole of the spleen.


References
- ↑ 1.0 1.1 Gaerte SC, Meyer CA, Winer-Muram HT, Tarver RD, Conces DJ (2002). "Fat-containing lesions of the chest". Radiographics. 22 Spec No: S61–78. doi:10.1148/radiographics.22.suppl_1.g02oc08s61. PMID 12376601.
- ↑ 2.0 2.1 Brant WE, Helms CA.(2007) Fundamentals of diagnostic radiology. Lippincott Williams & Wilkins.ISBN:0781765188
- ↑ Soto-Medina CA, Mier-Escurra EA, Treviño-Garza F, Ripa-Galván P (2014). "[Splenic hamartoma. Case report]". Cirugía Y Cirujanos (in Spanish; Castilian). 82 (3): 328–31. PMID 25238476.
- ↑ Eble JN (1998). "Angiomyolipoma of kidney". Seminars in Diagnostic Pathology. 15 (1): 21–40. PMID 9503504.
- ↑ Fenoglio KA, Wu J, Kim do Y, Simeone TA, Coons SW, Rekate H, Rho JM, Kerrigan JF (2007). "Hypothalamic hamartoma: basic mechanisms of intrinsic epileptogenesis". Seminars in Pediatric Neurology. 14 (2): 51–9. doi:10.1016/j.spen.2007.03.002. PMID 17544947.