Hamartoma CT
|
Hamartoma Microchapters |
|
Diagnosis |
|---|
|
Treatment |
|
Case Studies |
|
Hamartoma CT On the Web |
|
American Roentgen Ray Society Images of Hamartoma CT |
Editor-In-Chief: C. Michael Gibson, M.S., M.D. [1]Associate Editor(s)-in-Chief: Maria Fernanda Villarreal, M.D. [2]
Overview
CT scan may be helpful in the diagnosis of hamartoma. Findings on CT scan suggestive of hamartoma include smooth edge, focal collections of fat, or collections of fat alternating with foci of calcification.[1][2]
CT
- On computed tomography, common findings of pulmonary hamartoma, include:
- Isodense or hypodense solid masses.
- Hamartomas demonstrate heterogeneous contrast enhancement relative to adjacent normal parenchyma.
- Presence of fat in a well circumscribed solitary pulmonary nodule which does not demonstrate significant growth is essentially pathognomonic of a pulmonary hamartoma.
- The fat components may be localized or generalized within the nodule.[1]
- Calcification is typically dispersed in the form of multiple clumps throughout the lesion in a popcorn configuration.[2]
- The reported prevalence of calcification in hamartomas on CT varies from 5 to 50% while fat may be identified in up to 60% of hamartomas at CT.
- Fat can be recognised by comparing it to subcutaneous fat, and will typically have a Haunsfield measurement of -40 to -120 HU.
- Fat can only be identified in 60% of lesions.
- Thin section CT is therefore essential to avoid missing small foci of fat
- On computed tomography, spleen hamartomas findings, include:
- Isodense or hypodense solid masses
- Heterogeneous contrast enhancement relative to adjacent normal parenchyma.
- On computed tomography, common findings of renal hamartoma, include:
- Lesions involve the cortex and demonstrate macroscopic fat (less than -20 HU)
- Small renal hamartomas volume averaging may make differentiation from a small cyst difficult
- Renal hamartomas are are fat-poor
- Calcification is rare
Gallery
-
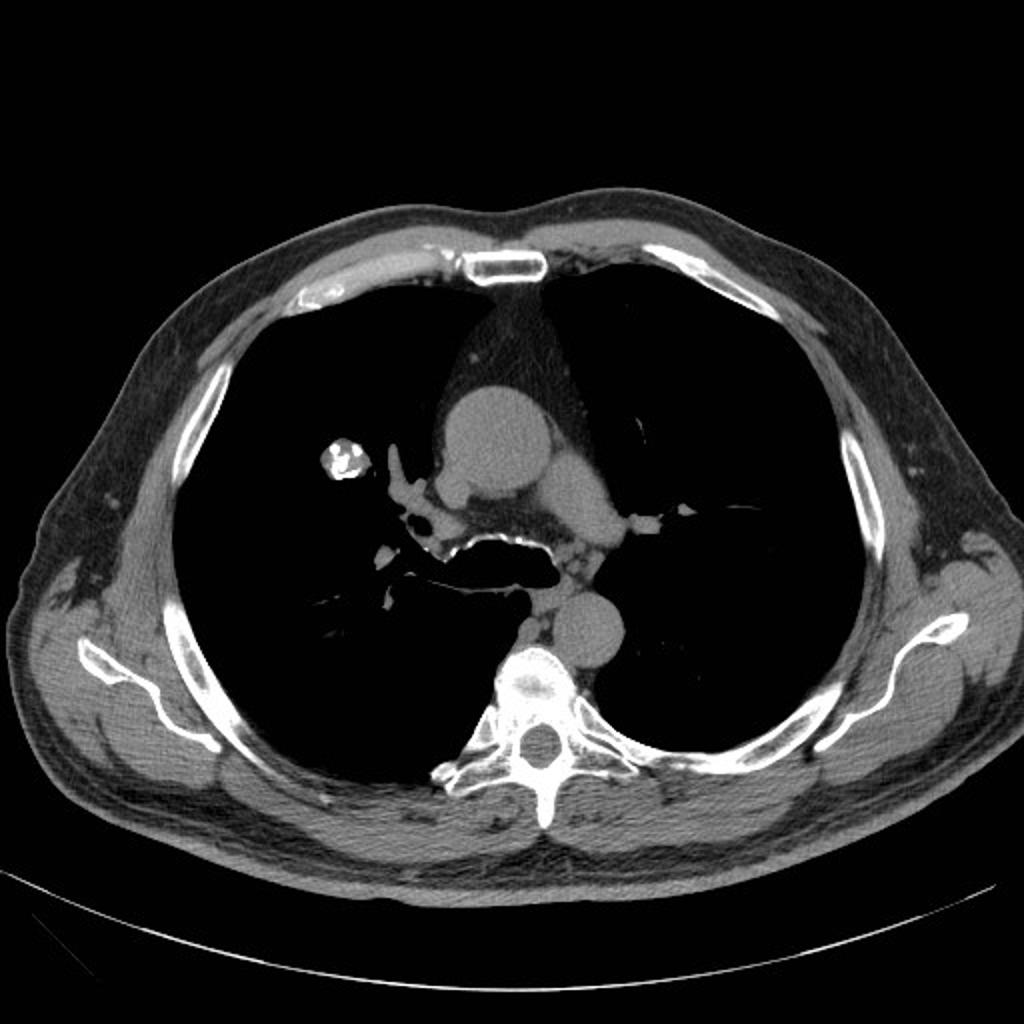
CT scan (CT) shows a well circumcised lesion, with intralesional fat and calcification "popcorn-like appearance" adjacent to the hilum.
-
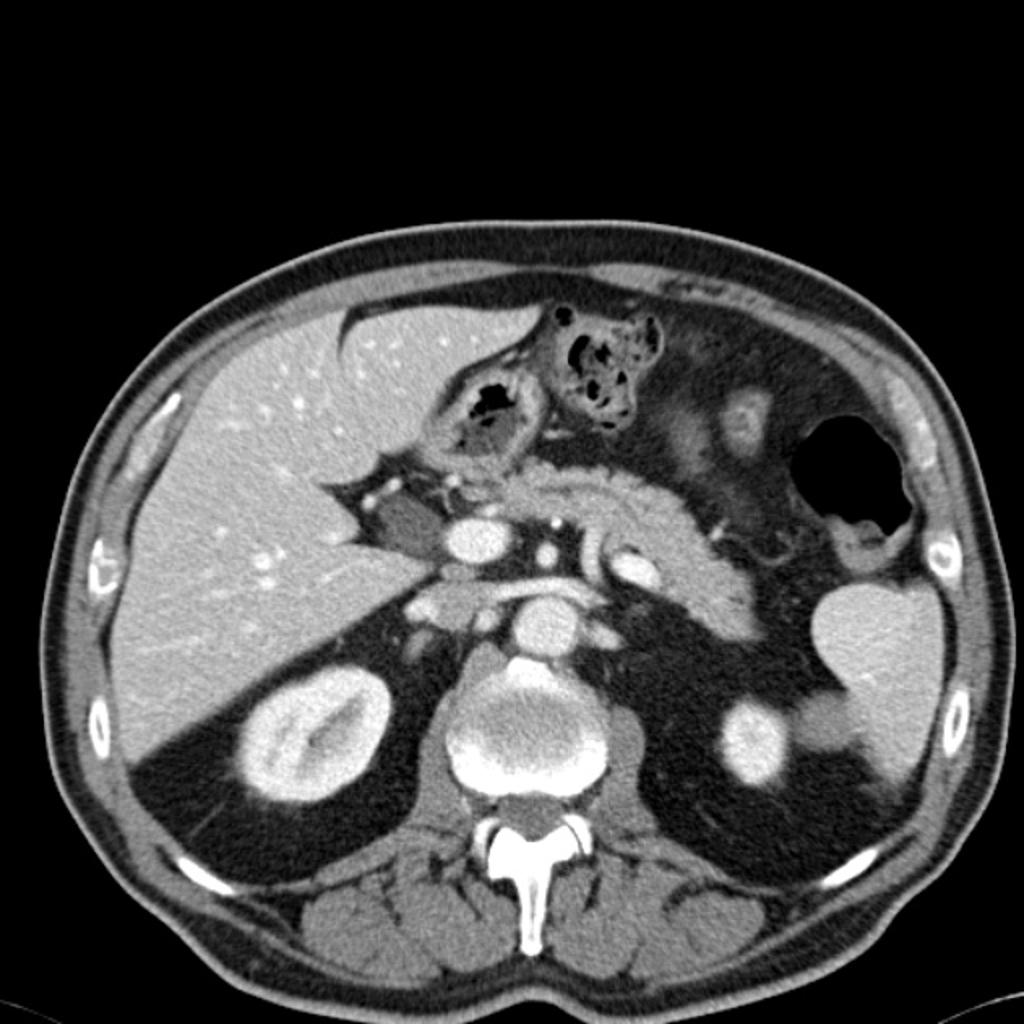
CT scan (CT) shows an isodense solid mass in the inferior pole of the spleen.


References
- ↑ 1.0 1.1 Gaerte SC, Meyer CA, Winer-Muram HT, Tarver RD, Conces DJ (2002). "Fat-containing lesions of the chest". Radiographics. 22 Spec No: S61–78. doi:10.1148/radiographics.22.suppl_1.g02oc08s61. PMID 12376601.
- ↑ 2.0 2.1 Brant WE, Helms CA.(2007) Fundamentals of diagnostic radiology. Lippincott Williams & Wilkins.ISBN:0781765188