First degree AV block EKG examples
Editor-In-Chief: C. Michael Gibson, M.S., M.D. [1]
For the main page on First Degree AV Block, click here.
EKG Examples
Shown below is an electrocardiogram with a sinus rhythm. The PR interval is prolonged (> 200ms) and the QRS is a left ward axis (< -30 degrees). The EKG shows a first degree heart block and a left anterior fascicular block.
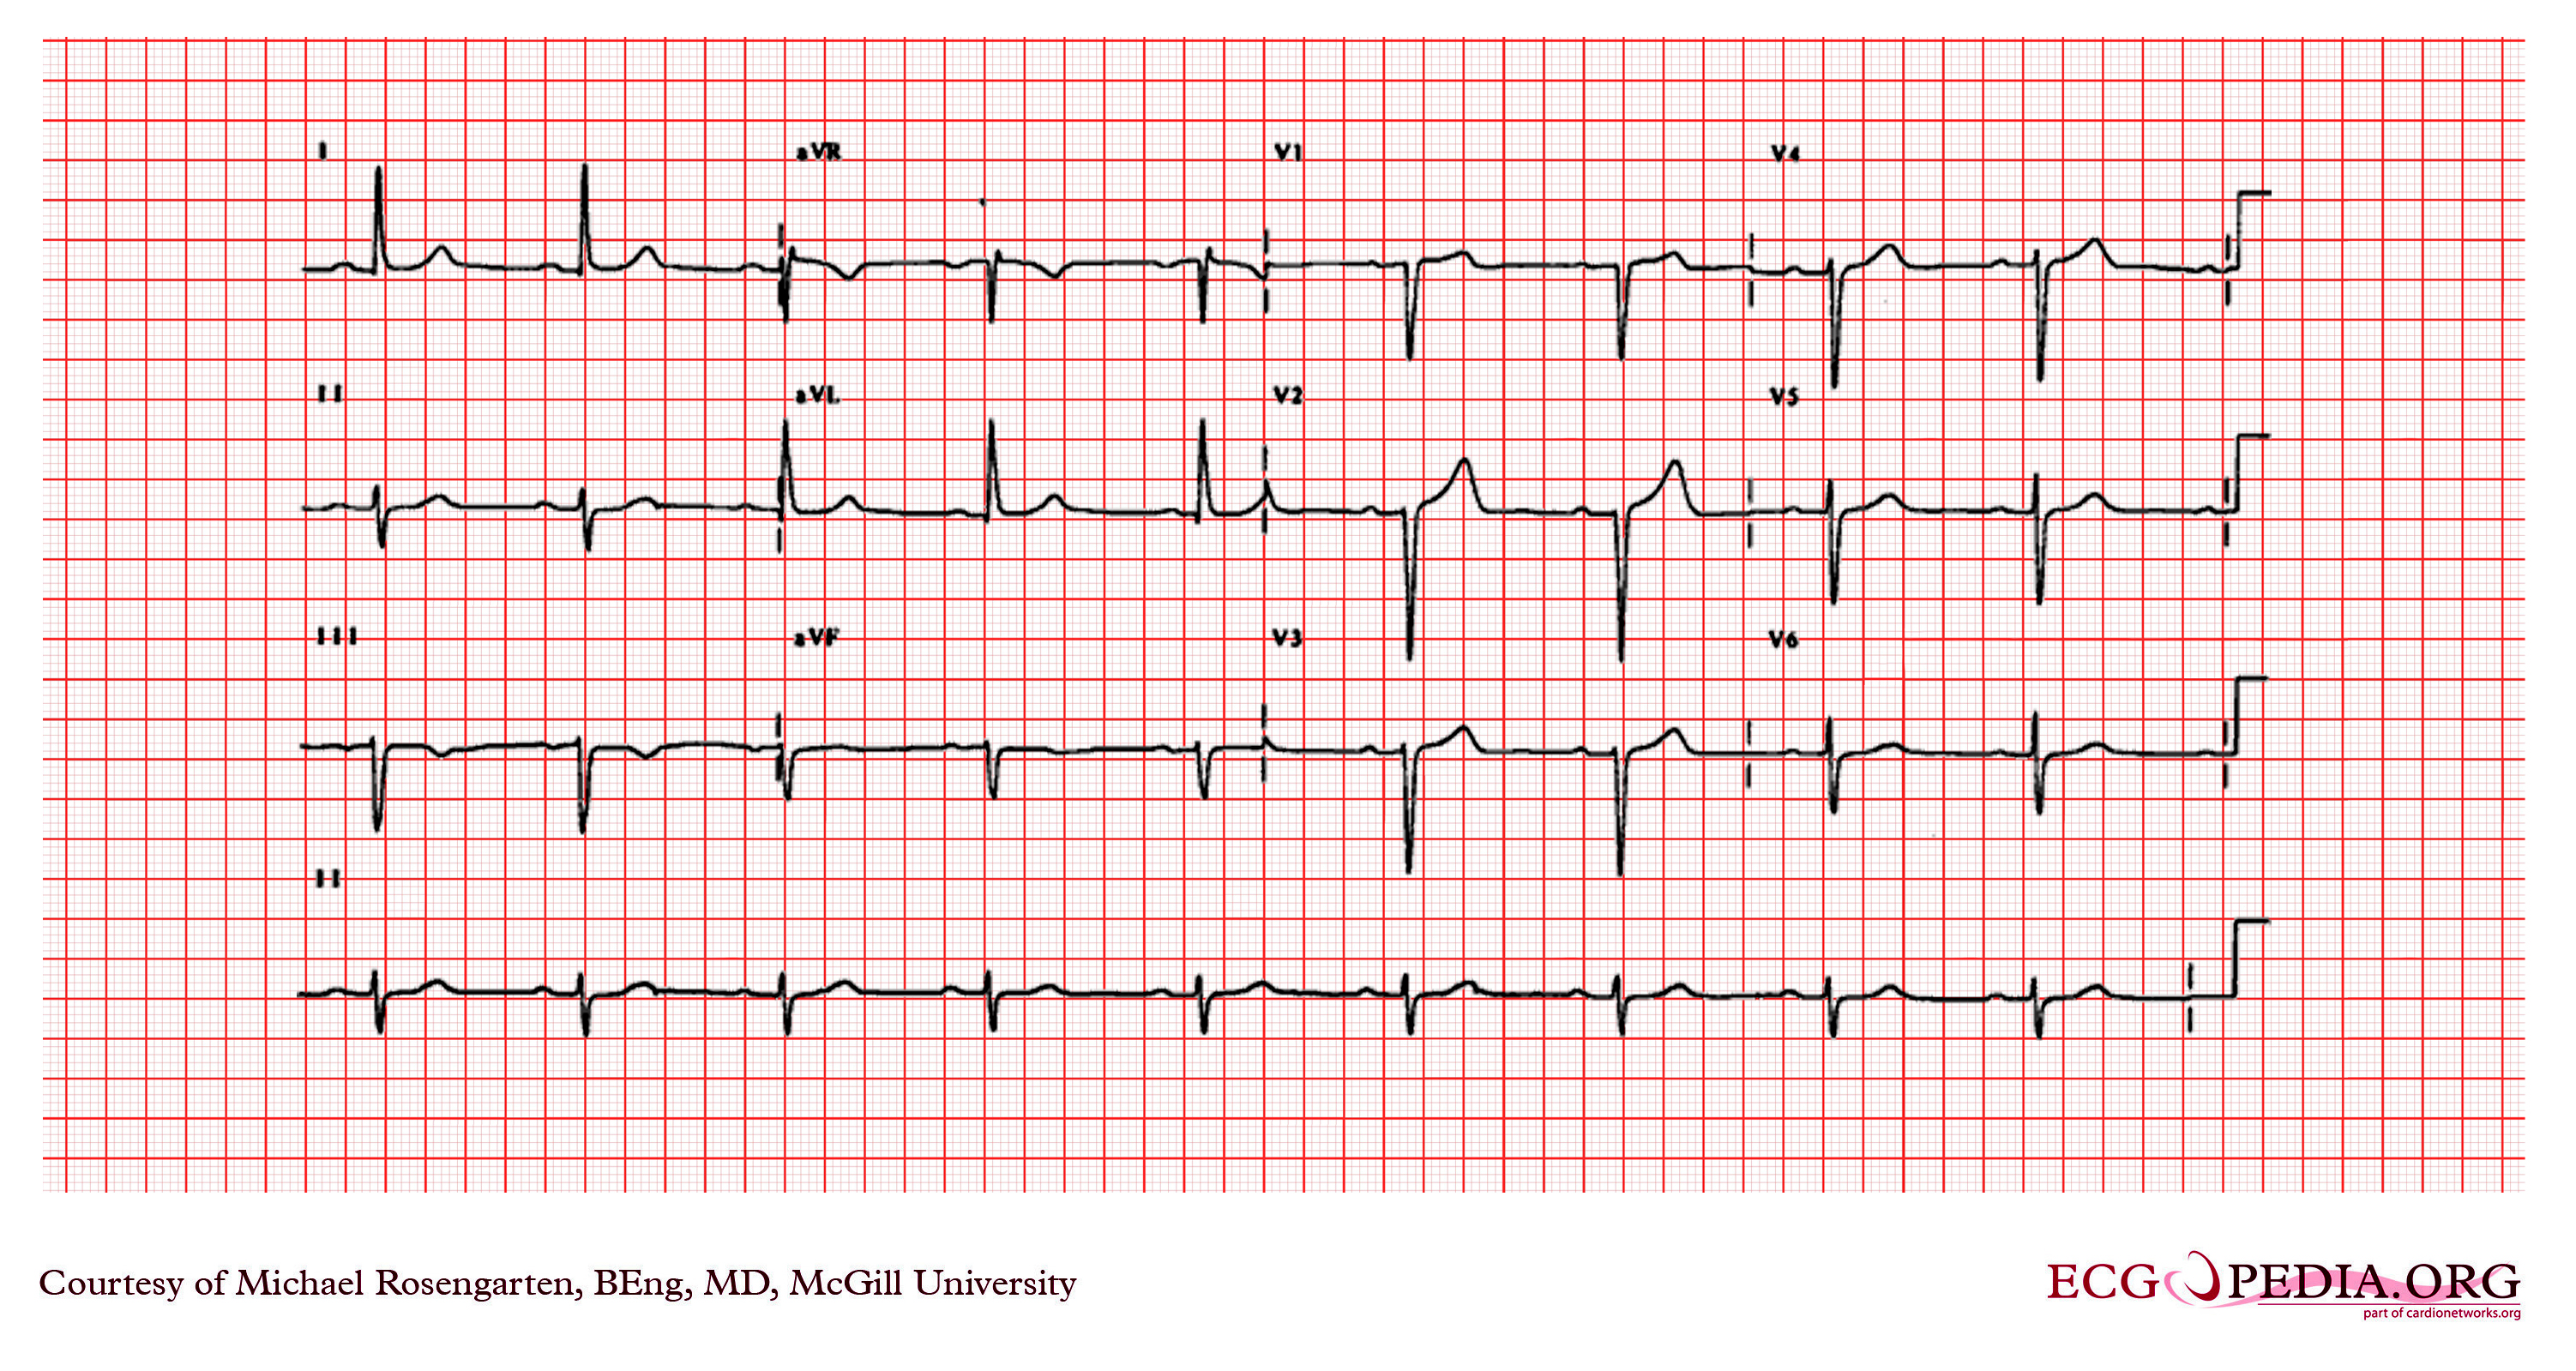
Copyleft image obtained courtesy of ECGpedia, http://en.ecgpedia.org/wiki/Main_Page
Shown below is an electrocardiogram of first degree AV block with increased PR interval.

Copyleft image obtained courtesy of ECGpedia, http://en.ecgpedia.org/wiki/Main_Page
Shown below is an electrocardiogram of first degree AV block with increased PR interval.
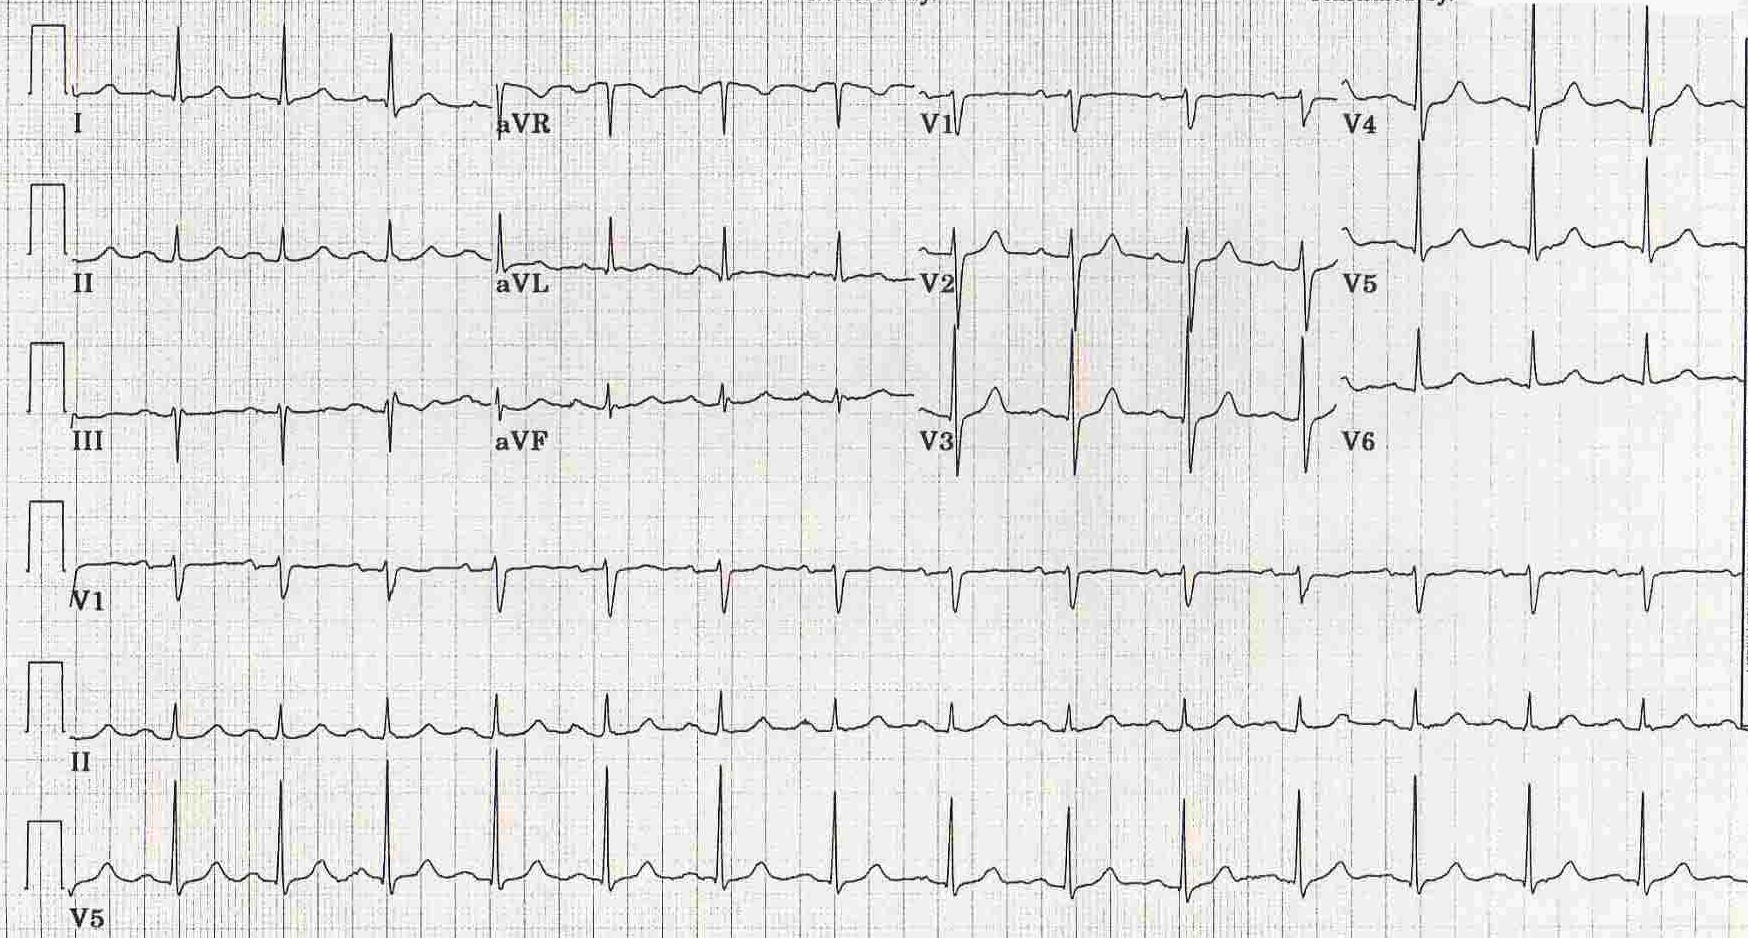
Copyleft image obtained courtesy of ECGpedia, http://en.ecgpedia.org/wiki/Main_Page
Shown below is an electrocardiogram demonstrating a regular rhythm at a rate of 65/min. The PR interval is 400 ms, the QRS is approximately 110 ms, and there are Qs waves in I, II, aVL, and poor R waves in the precordial leads. This is sinus rhythm with a marked first degree heart block. The QRS suggests an extensive anterior/lateral myocardial infarction.
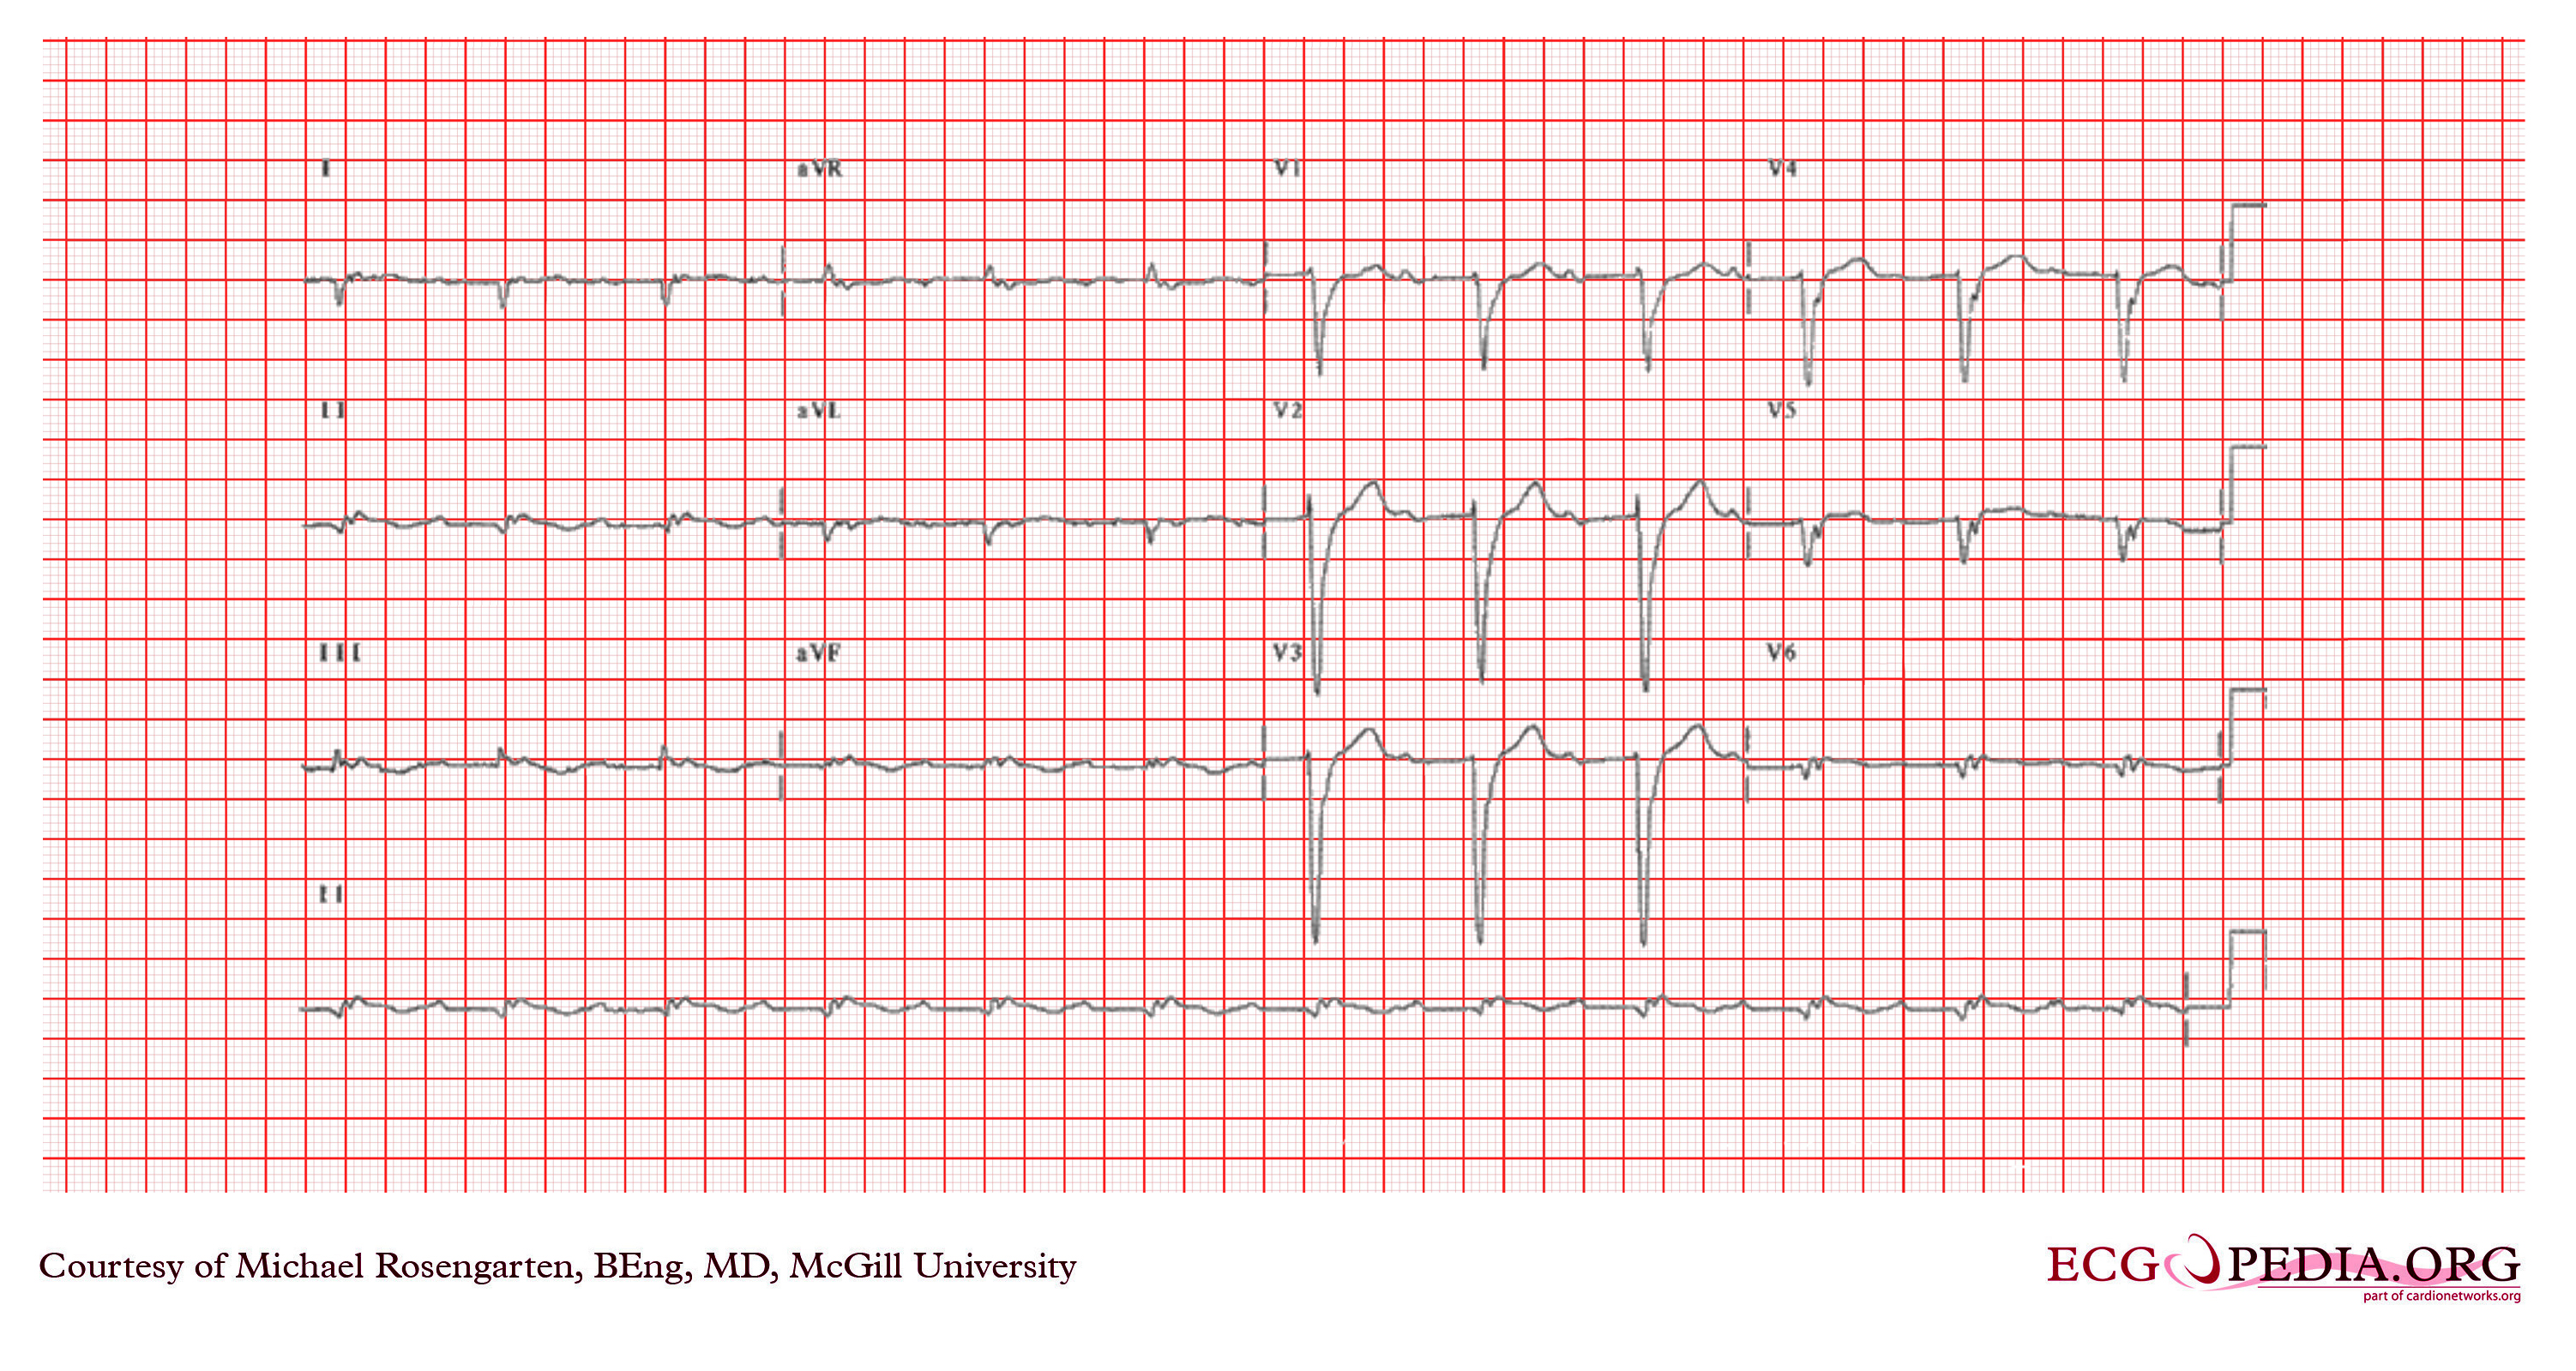
Copyleft image obtained courtesy of ECGpedia, http://en.ecgpedia.org/wiki/Main_Page
Shown below is an electrocardiogram with sinus rhythm and a marked first degree heart block. In this case the PR interval is about 400 ms. A Holter monitor showed second degree but not third degree A/V block.
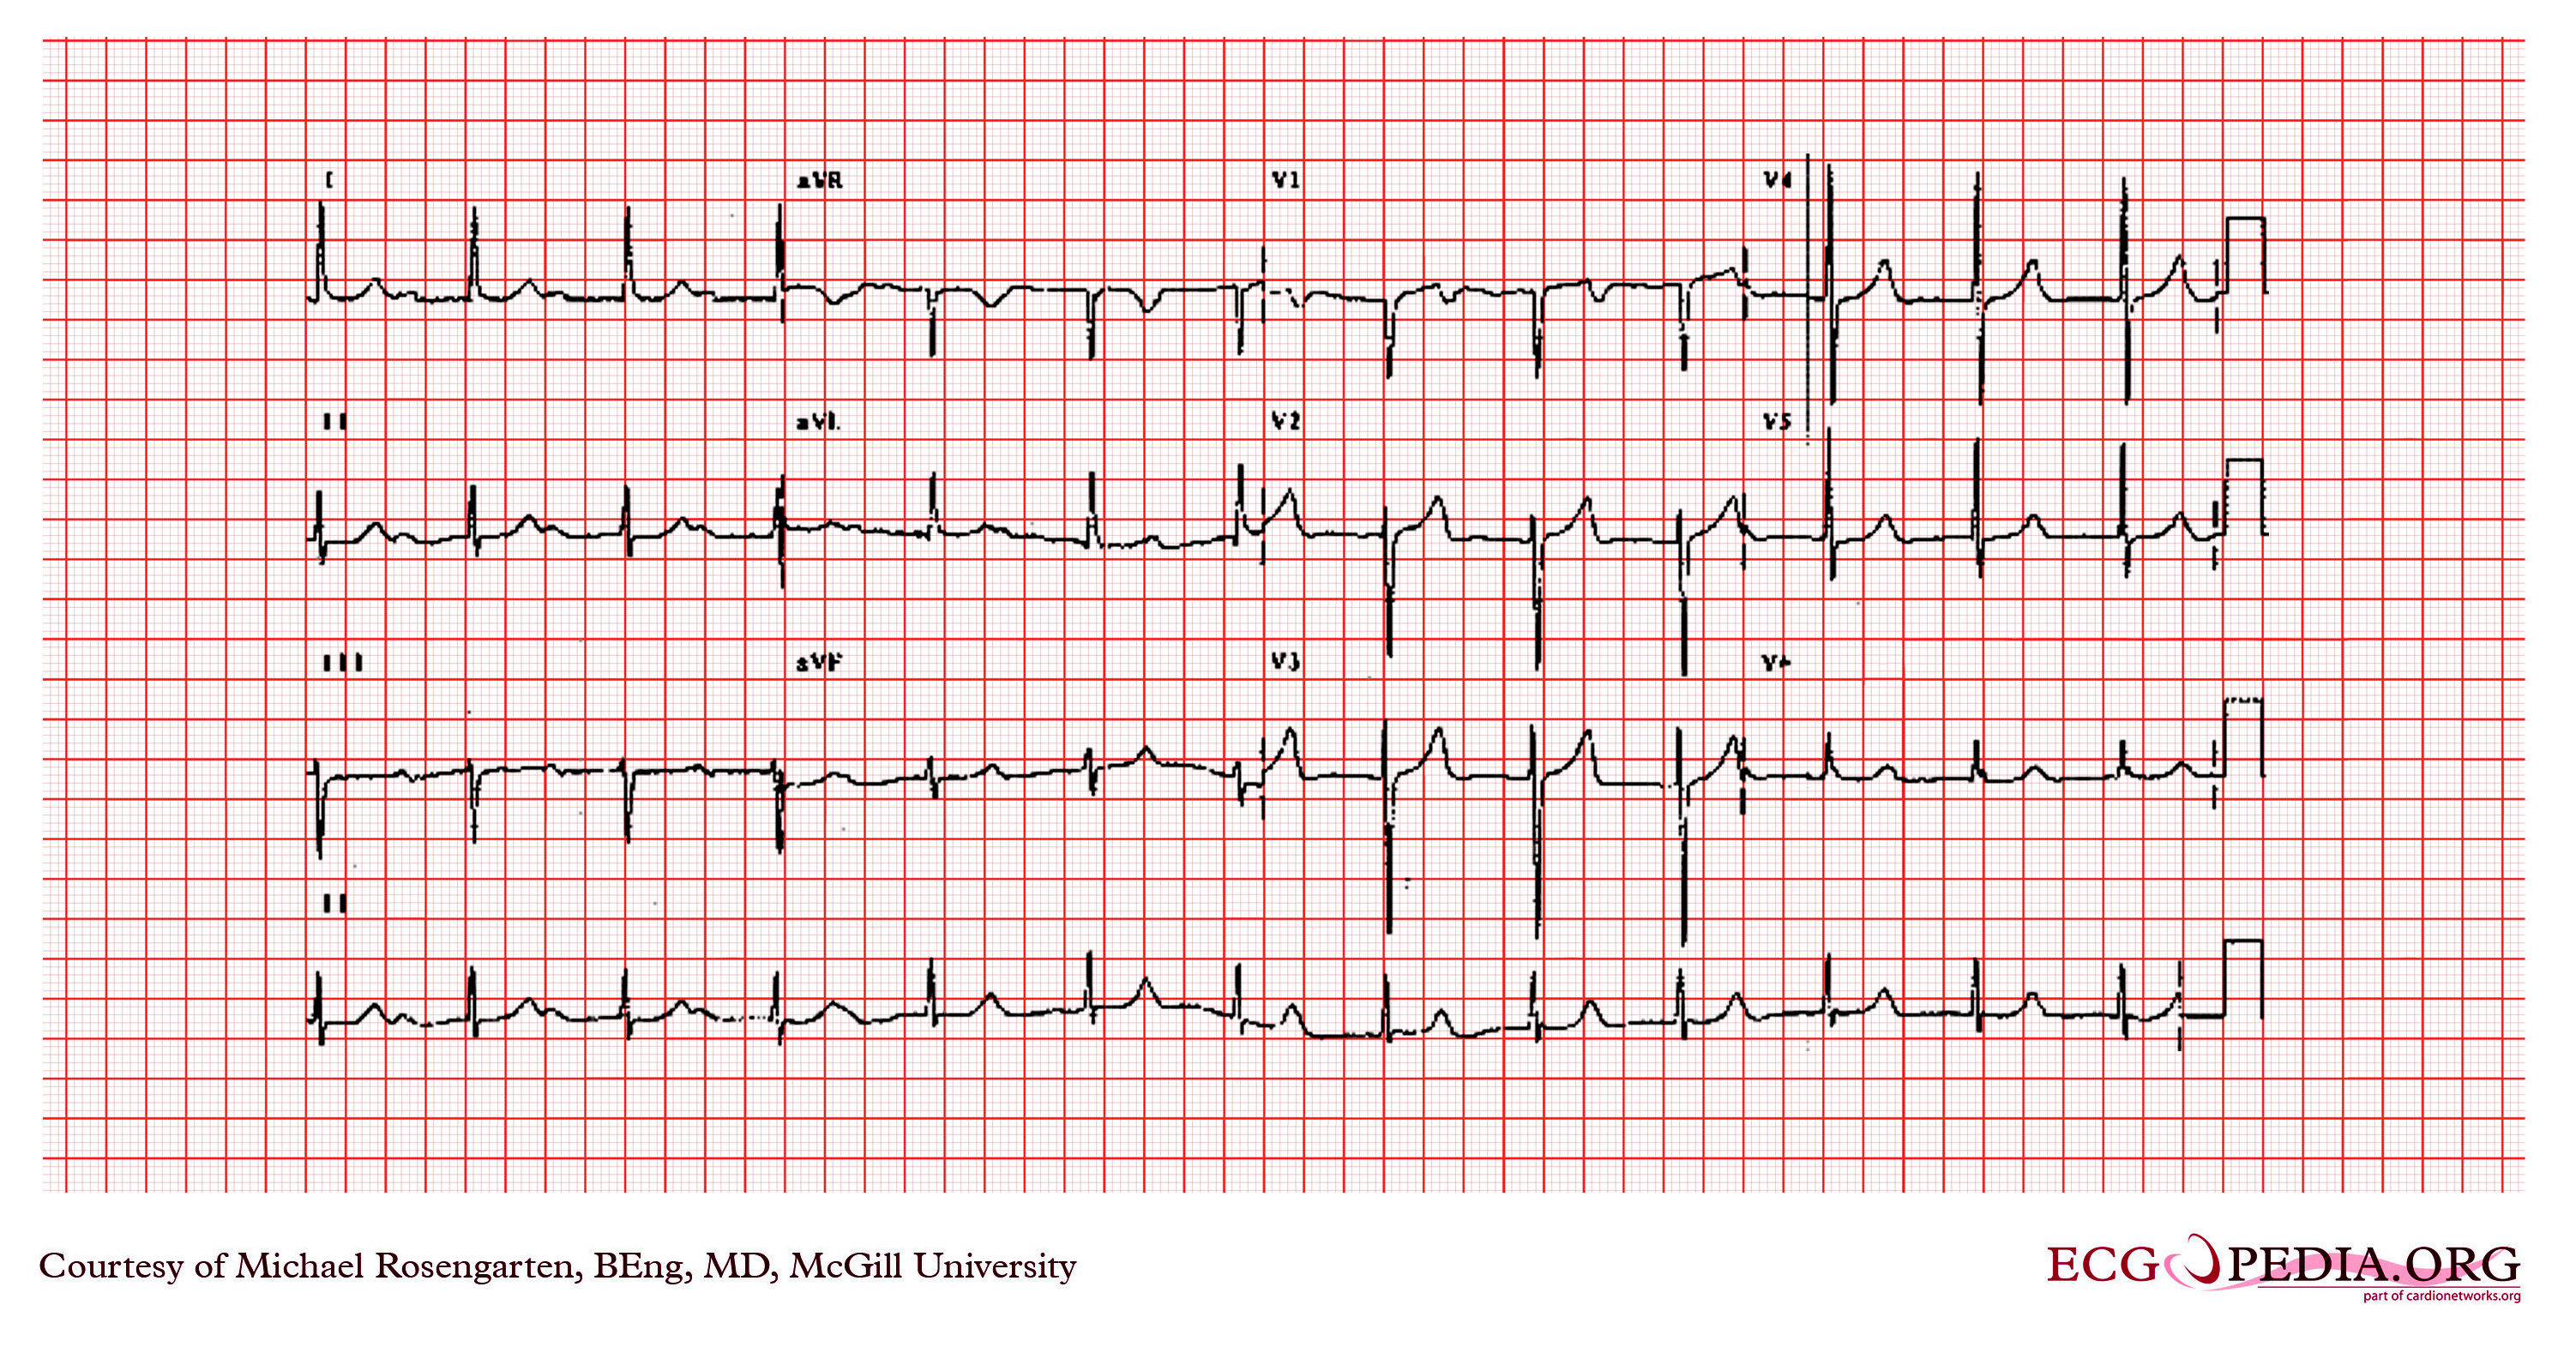
Copyleft image obtained courtesy of ECGpedia, http://en.ecgpedia.org/wiki/Main_Page
Shown below is an electrocardiogram with a first degree AV block

Copyleft image obtained courtesy of ECGpedia, http://en.ecgpedia.org/wiki/Main_Page
Shown below is an electrocardiogram depicting sinus rhythm with a first degree A/V block (> 200ms). There is terminal P wave negativity inV1 suggestive of left atrial abnormality. There is left anterior fascicular block (axis < -30 degrees). The ST segment is slightly elevated in leads II and aVF with T wave inversion suggesting inferior ischemiaor infarction.
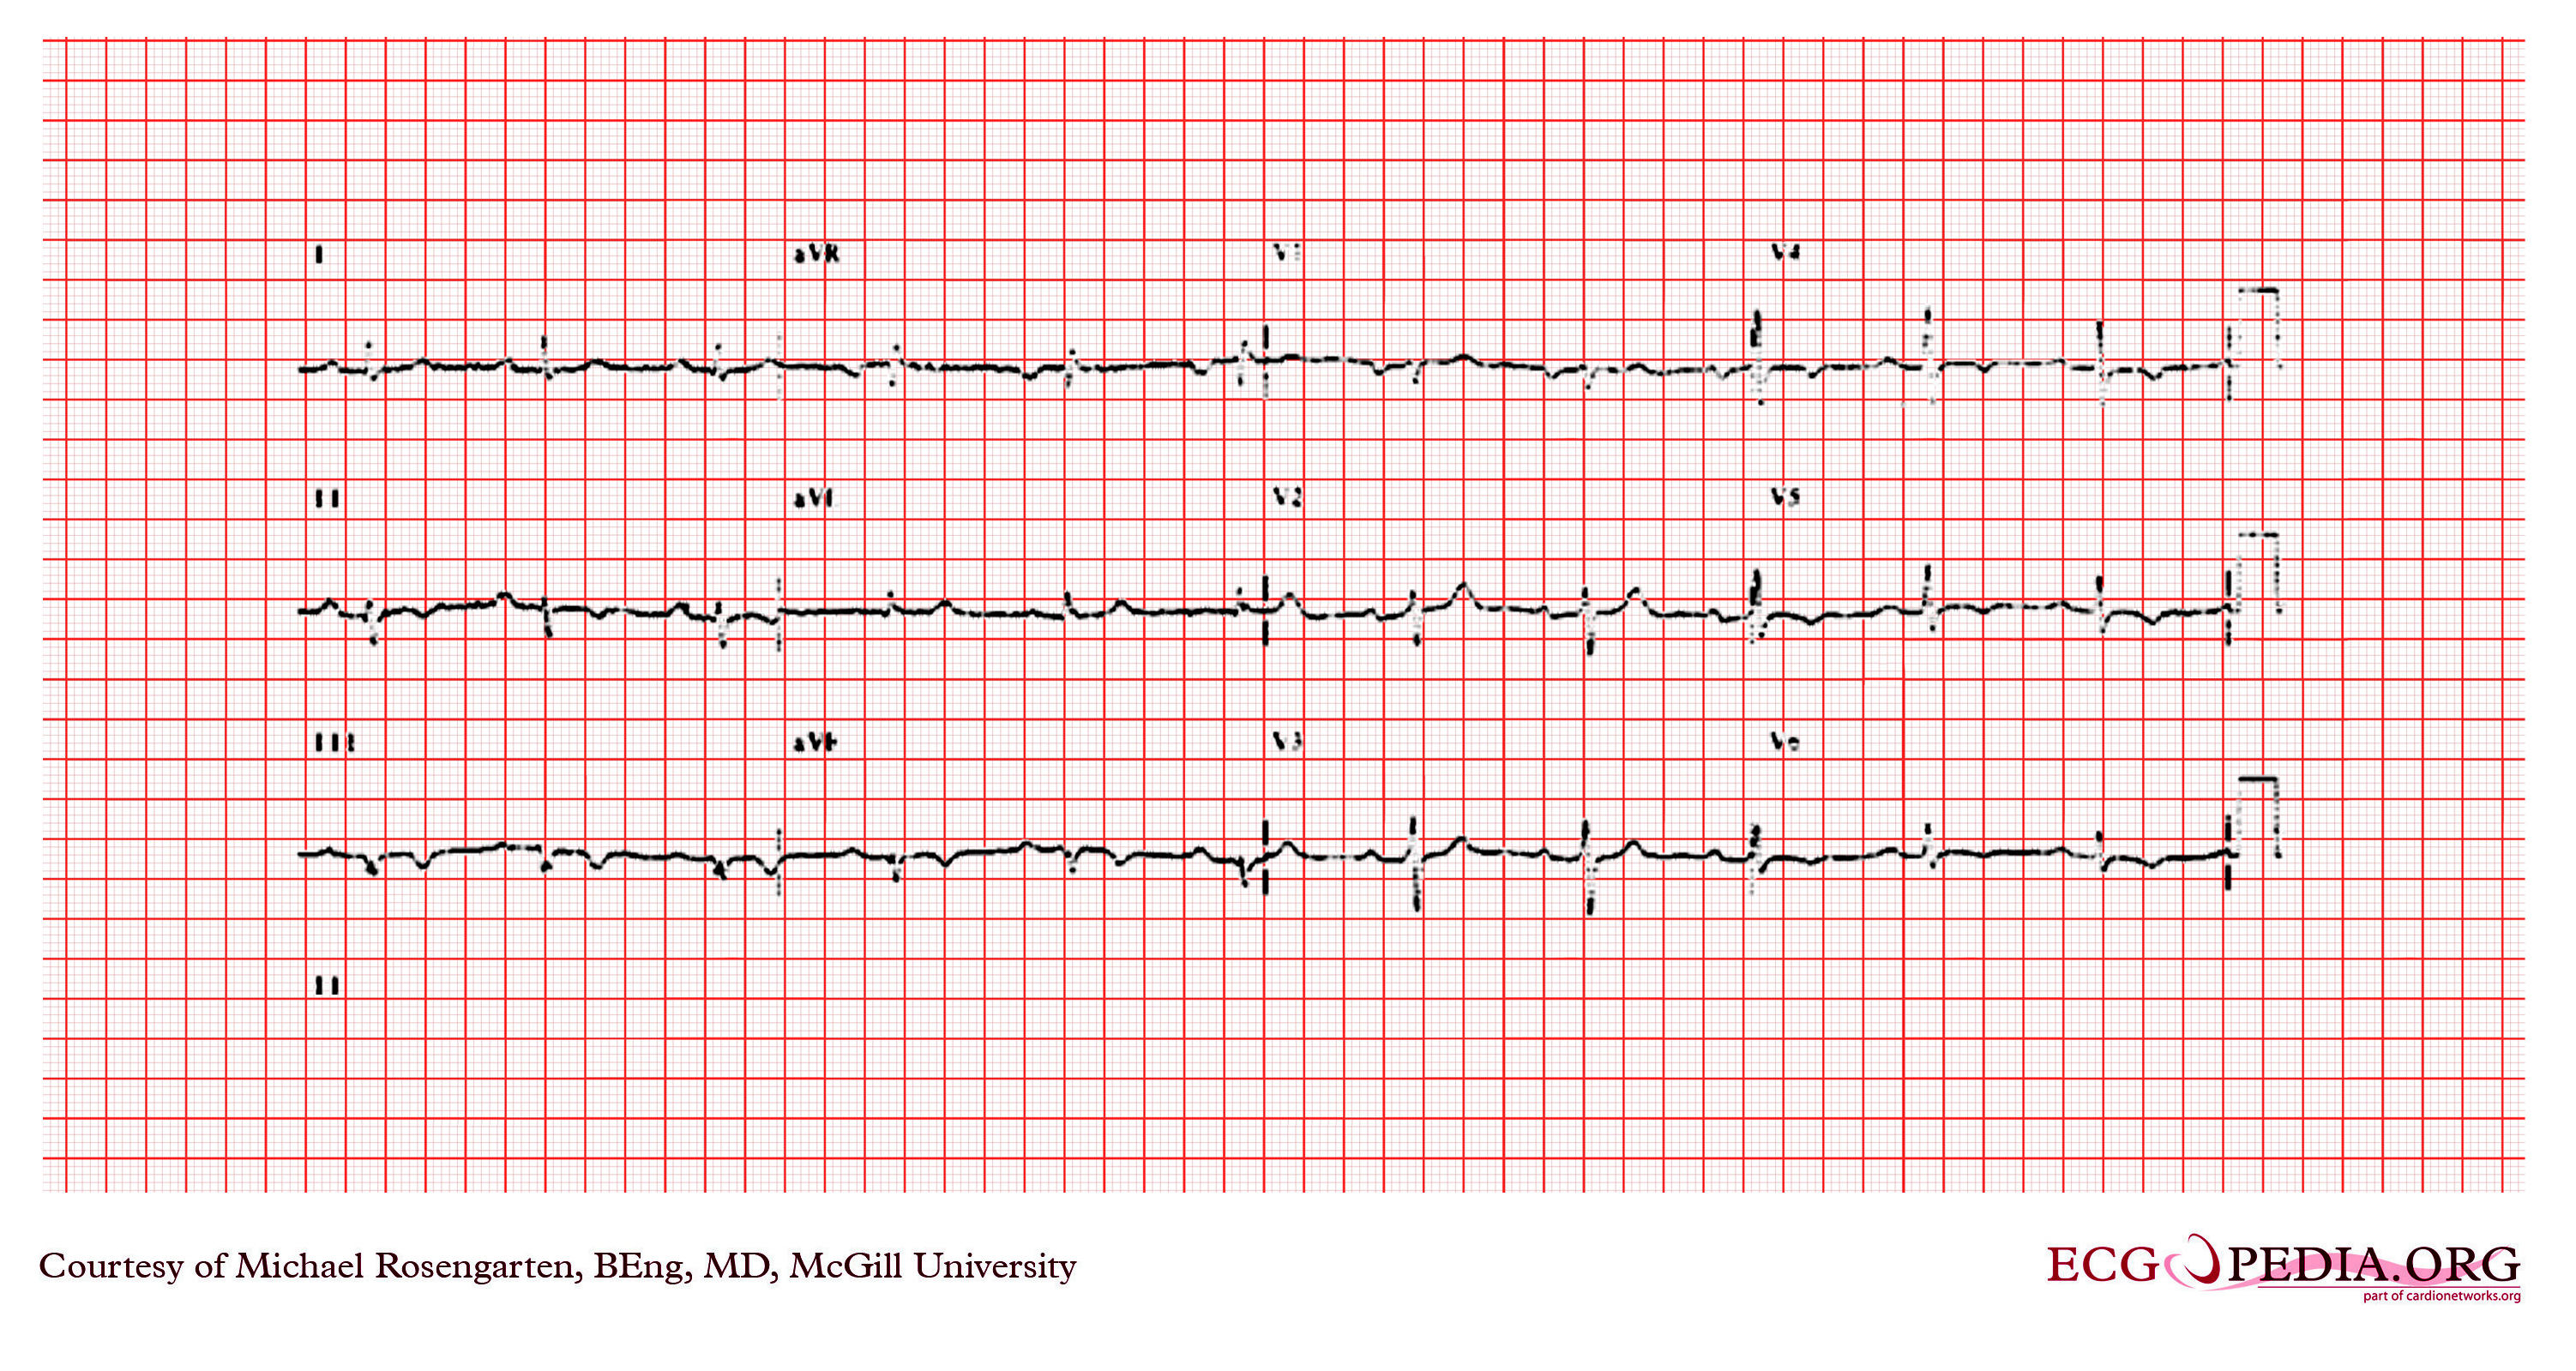
Copyleft image obtained courtesy of ECGpedia, http://en.ecgpedia.org/wiki/Main_Page
Shown below is an electrocardiogram depicting a first degree heart block with a left anterior hemi-block.
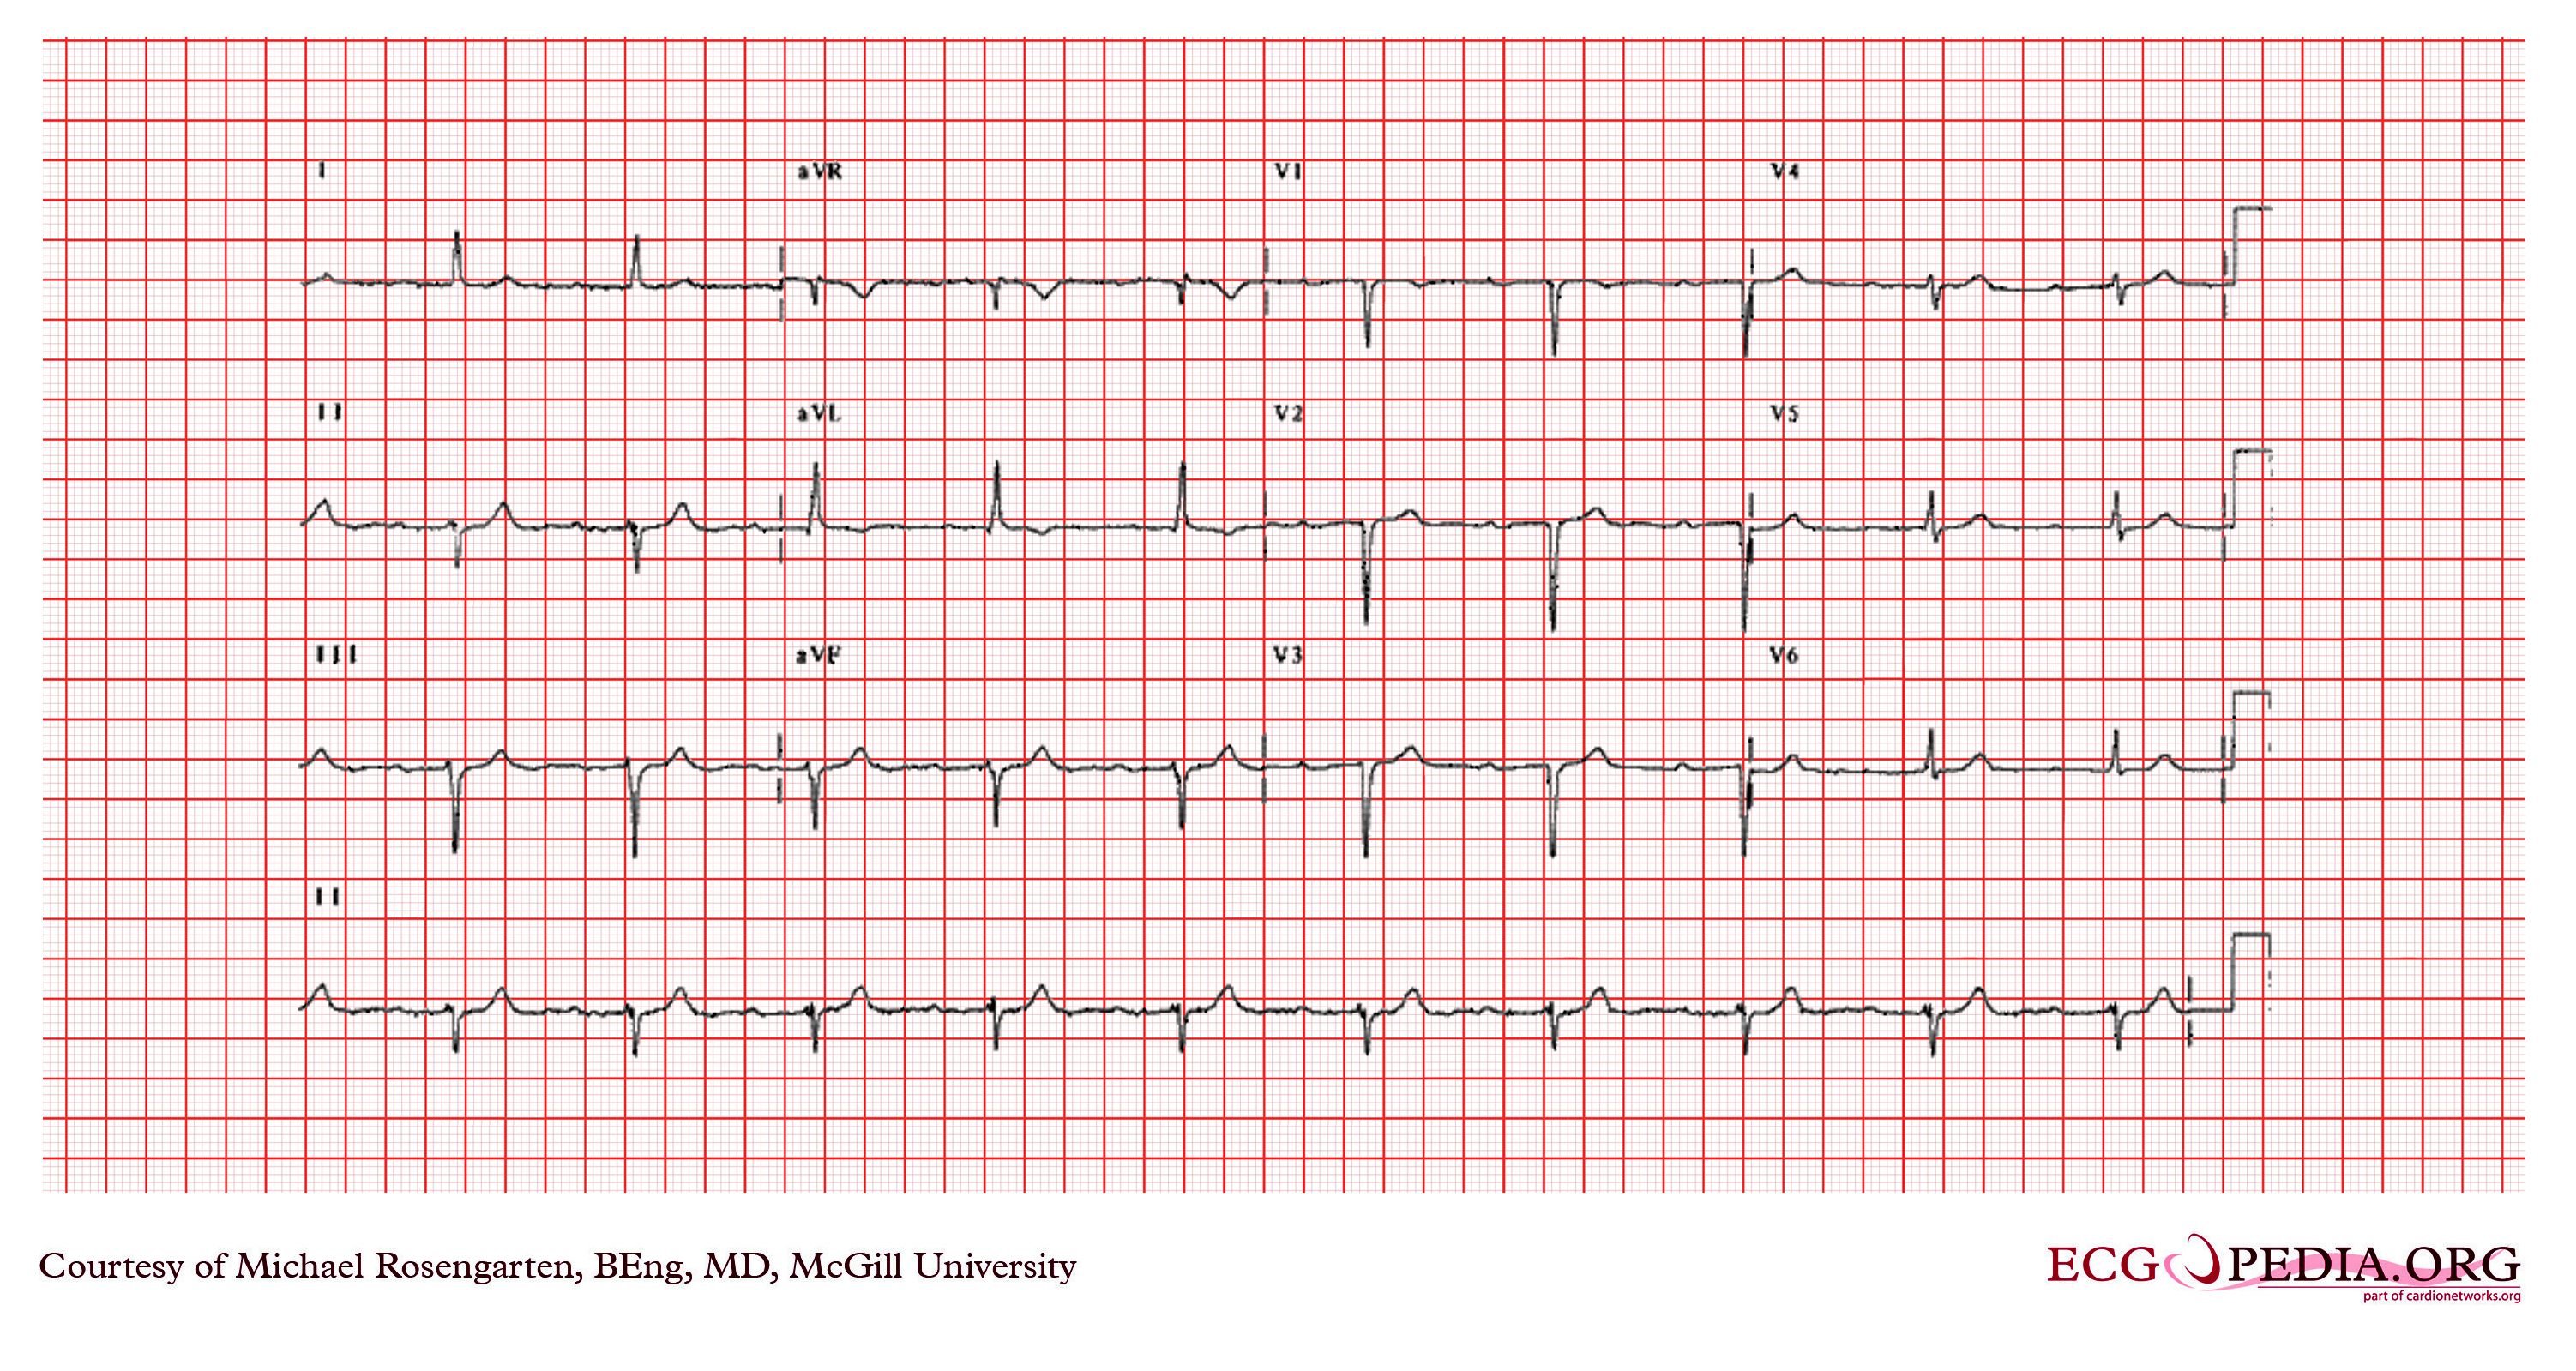
Copyleft image obtained courtesy of ECGpedia, http://en.ecgpedia.org/wiki/Main_Page
Shown below is an electrocardiogram depicting sinus rhythm with a prolonged PR interval (>120ms.) which is first degree A/V block. There is also a left axis deviation (axis between -30 and -90 degrees) with R waves in the inferior leads. This axis deviation is consitent with a left anterior fasicular block.
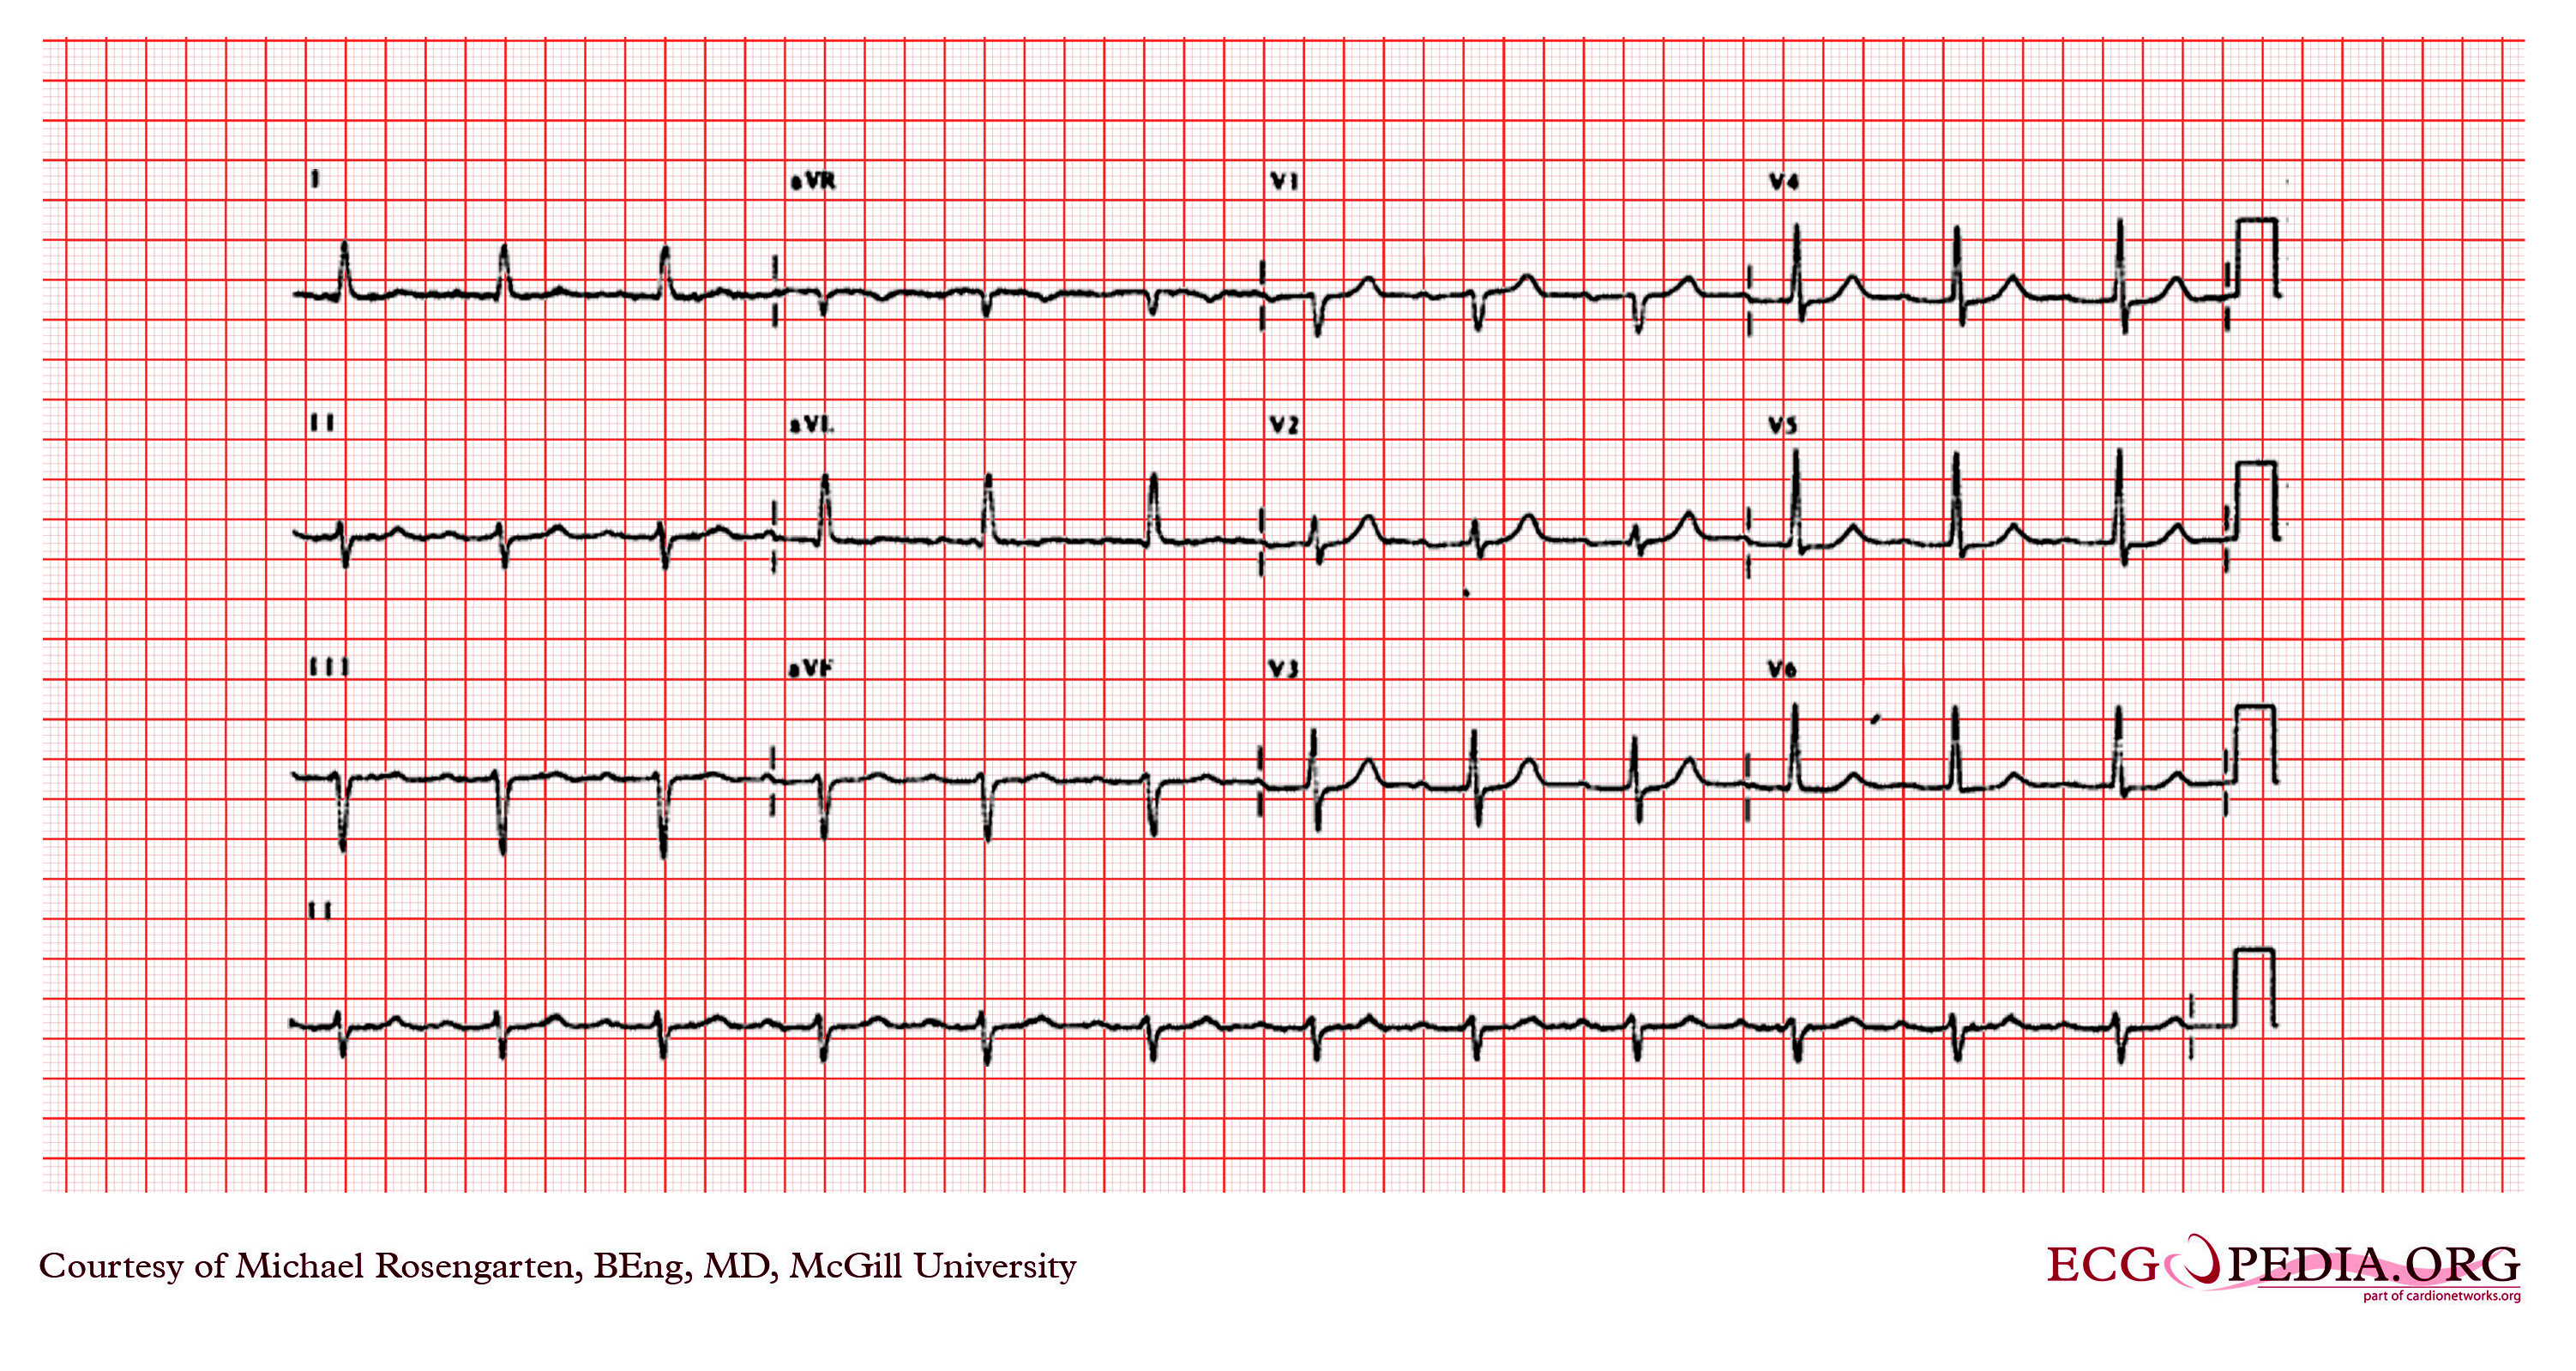
Copyleft image obtained courtesy of ECGpedia, http://en.ecgpedia.org/wiki/Main_Page