Descriptive statistics
Jump to navigation
Jump to search

Measurements of central tendency
- Mean In general understanding, the mean is the average. Suppose there are five people. The people have, respectively, 1 TV in their house, 4 TVs, 2 TVs, no TVs and 3 TVs. You would say that the 'mean' number of TVs in the house is 2 (1+4+2+0+3)/5=2.
- Median The median is the point at which half are above and half are below. In the above example, the median is also 2, because in this group of 5 people, 2 people have more than 2 TVs in their house and 2 people have fewer than 2 TVs in their house.
Measurements of variation
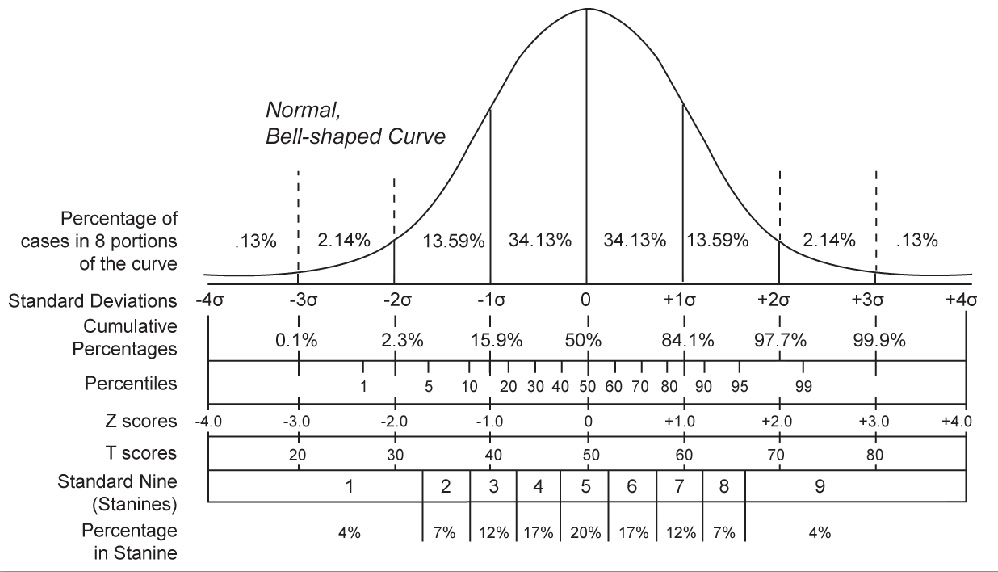
- Standard deviation (SD) is a measure of variation or scatter. The standard deviation does not change with sample size.
- Variance is the square of the standard deviation:
- <math>s^2</math>
- Standard error of the mean (SEM) measures the how accurately you know the mean of a population and is always smaller than the SD.[1] The SEM becomes smaller as the sample size increases. The sample standard devision (S) and SEM are related by:
- <math>SE_\bar{x}\ = \frac{s}{\sqrt{n}}</math>
- 95% confidence interval is + 1.96 * standard error.
- Coefficient of variation (CV) is the ratio of the standard deviation <math>\ \sigma </math> to the mean <math>\ \mu </math>, <math>c_{\rm v} = \frac{\sigma}{\mu}.</math>[2]. "Commonly, a CV of < 5% is deemed acceptable[2].
See also
- List of basic statistics topics
- List of statistical topics
- Analysis of variance (ANOVA)
- Central limit theorem
- Confidence interval
References
- ↑ "What is the difference between "standard deviation" and "standard error of the mean"? Which should I show in tables and graphs?". Retrieved 2008-09-18.
- ↑ 2.0 2.1 Campbell, Michael J.; Walters, Stephen John; Machin, David (2021). Medical statistics : a textbook for the health sciences. Chichester, West Sussex. ISBN 978-1-119-42364-5. OCLC 1163960928.