Acute myeloid leukemia epidemiology and demographics: Difference between revisions
Rim Halaby (talk | contribs) No edit summary |
Rim Halaby (talk | contribs) No edit summary |
||
| Line 17: | Line 17: | ||
** Under 65 years: 1.8 per 100,000 | ** Under 65 years: 1.8 per 100,000 | ||
** 65 and over: 17.5 per 100,000 | ** 65 and over: 17.5 per 100,000 | ||
===Gender=== | ===Gender=== | ||
| Line 26: | Line 25: | ||
** In females: 3.32 per 100,000 persons | ** In females: 3.32 per 100,000 persons | ||
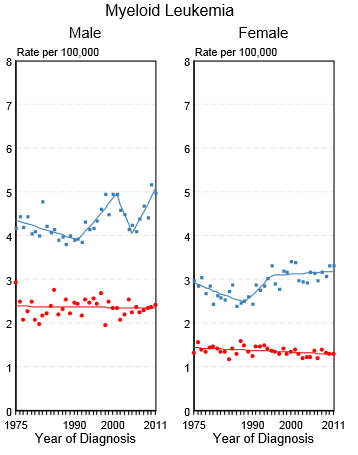
* Shown below is an image depicting the observed [[incidence]] of | * Shown below is an image depicting the observed [[incidence]] of myeloid leukemia by gender the United States between 1975 and 2011. These graphs are adapted from [[SEER]]: The Surveillance, Epidemiology, and End Results Program of the National Cancer Institute.<ref name="SEER">Howlader N, Noone AM, Krapcho M, Garshell J, Miller D, Altekruse SF, Kosary CL, Yu M, Ruhl J, Tatalovich Z,Mariotto A, Lewis DR, Chen HS, Feuer EJ, Cronin KA (eds). SEER Cancer Statistics Review, 1975-2011, National Cancer Institute. Bethesda, MD, http://seer.cancer.gov/csr/1975_2011/, based on November 2013 SEER data submission, posted to the SEER web site, April 2014.</ref> | ||
[[Image:Observed incidence of myeloid leukemia in USA.PNG|Observed [[incidence]] of | [[Image:Observed incidence of myeloid leukemia in USA.PNG|Observed [[incidence]] of myeloid leukemia by gender the United States between 1975 and 2011]] | ||
===Developed Countries=== | ===Developed Countries=== | ||
Revision as of 18:15, 12 June 2014
|
Acute myeloid leukemia Microchapters |
|
Diagnosis |
|---|
|
Treatment |
|
Case Studies |
|
Acute myeloid leukemia epidemiology and demographics On the Web |
|
American Roentgen Ray Society Images of Acute myeloid leukemia epidemiology and demographics |
|
Acute myeloid leukemia epidemiology and demographics in the news |
|
Blogs on Acute myeloid leukemia epidemiology and demographics |
|
Risk calculators and risk factors for Acute myeloid leukemia epidemiology and demographics |
Editor-In-Chief: C. Michael Gibson, M.S., M.D. [1]; Associate Editor(s)-in-Chief: Raviteja Guddeti, M.B.B.S. [2]
Overview
Acute myeloid leukemia (AML) is a relatively rare cancer. In 2011, the age-adjusted incidence of AML was 4.05 per 100,000 persons in the United States.[1] The incidence of AML increases with age; the median age at diagnosis is 63 years. AML accounts for about 90% of all acute leukemias in adults, but is rare in children. There is some geographic variation in the incidence of AML. In adults, the highest rates are seen in North America, Europe, and Oceania.
Epidemiology and Demographics
Incidence
- AML is a relatively rare cancer. There are approximately 10,500 new cases each year in the United States, and the incidence rate has remained stable from 1995 through 2005. AML accounts for 1.2% of all cancer deaths in the United States.
- In 2011, the age-adjusted incidence of AML was 4.05 per 100,000 persons in the United States.[1]
Age
- The incidence of AML increases with age; the median age at diagnosis is 63 years. AML accounts for about 90% of all acute leukemias in adults, but is rare in children. The rate of therapy-related AML (that is, AML caused by previous chemotherapy) is rising; therapy-related disease currently accounts for about 10–20% of all cases of AML.[2]
- While the overall age-adjusted incidence of AML in the United States between 2007 and 2011 is 3.8 per 100,000, the age-adjusted incidence of AML by age category is:[1]
- Under 65 years: 1.8 per 100,000
- 65 and over: 17.5 per 100,000
Gender
- AML is slightly more common in men, with a male-to-female ratio of 1.3:1.[3]
- In the United States, the age-adjusted incidence of AML by gender on 2011 is:[1]
- In males: 4.97 per 100,000 persons
- In females: 3.32 per 100,000 persons
- Shown below is an image depicting the observed incidence of myeloid leukemia by gender the United States between 1975 and 2011. These graphs are adapted from SEER: The Surveillance, Epidemiology, and End Results Program of the National Cancer Institute.[1]
Developed Countries
- There is some geographic variation in the incidence of AML. In adults, the highest rates are seen in North America, Europe, and Oceania.
- In contrast, childhood AML is less common in North America.
Developing Countries
- Adult AML is rarer in Asia and Latin America.[4][5]
- Childhood AML is less common in India than in other parts of Asia.[6]
These differences may be due to population genetics, environmental factors, or a combination of the two.
References
- ↑ 1.0 1.1 1.2 1.3 1.4 Howlader N, Noone AM, Krapcho M, Garshell J, Miller D, Altekruse SF, Kosary CL, Yu M, Ruhl J, Tatalovich Z,Mariotto A, Lewis DR, Chen HS, Feuer EJ, Cronin KA (eds). SEER Cancer Statistics Review, 1975-2011, National Cancer Institute. Bethesda, MD, http://seer.cancer.gov/csr/1975_2011/, based on November 2013 SEER data submission, posted to the SEER web site, April 2014.
- ↑ Leone G, Mele L, Pulsoni A, et al: The incidence of secondary leukemias. Haematologica 84:937, 1999. PMID 10509043
- ↑ Greenlee RT, Hill-Harmon MB, Murray T, et al: Cancer statistics, 2001 erratum appears in CA Cancer J Clin 2001 Mar-Apr;51(2):144. CA Cancer J Clin 2001;51:15–36. PMID 11577478
- ↑ Linet MS: The leukemias: Epidemiologic aspects. In Lilienfeld AM (ed): Monographs in Epidemiology and Biostatistics. New York, Oxford University Press, 1985, p I.
- ↑ Aoki K, Kurihars M, Hayakawa N, et al: Death Rates for Malignant Neoplasms for Selected Sites by Sex and Five-Year Age Group in 33 Countries 1953–57 to 1983–87. Nagoya, Japan, University of Nagoya Press, International Union Against Cancer, 1992.
- ↑ Bhatia S, Neglia JP: Epidemiology of childhood acute myelogenous leukemia. J Pediatr Hematol Oncol 17:94, 1995. PMID 7749772
