ST segment morphology
Editor-In-Chief: C. Michael Gibson, M.S., M.D. [1]
Associate Editor-In-Chief: Cafer Zorkun, M.D., Ph.D. [2]
The Normal ST segment
The ST segment represents the ventricular repolarisation. Repolarisation follows upon contraction and depolarisation. During repolarisation the cardiomyocytes elongate and prepare for the next heartbeat. This process takes much more time than the depolarisation. Repolarisation is not passive elongation by stretch, it is an active process during which energy is consumed. On the ECG, the repolarisation phase starts at the junction, or j point, and continues until the T wave. The normal ST segment should not be flat. It should have an upward concavity sometimes referred to as a “take-off”.
The T wave is usually concordant with the QRS complex. Thus if the QRS complex is positive in a certain lead (the area under the curve above the baseline is greater than the area under the curve below the baseline) than the T wave usually is positive too in that lead. Accordingly the T wave is normally upright or positive in leads I, II, AVL, AVF and V3-V6. The T wave is negative in V1 and AVR. The T wave flips around V2, but there is some genetical influence in this as in Blacks the T wave usually flips around V3.
The T wave angle is the result of small differences in the duration of the repolarisation between the endocardial and epicardial layers of the left ventricle. The endocardial myocytes need a little more time to repolarise (about 22 msec). This difference causes an electrical current from the endocardium to the epicardium, which reads as a positive signal on the ECG. [1]
Below image shows normal ST segment. As can be seen in the image, it should have an upward concavity.

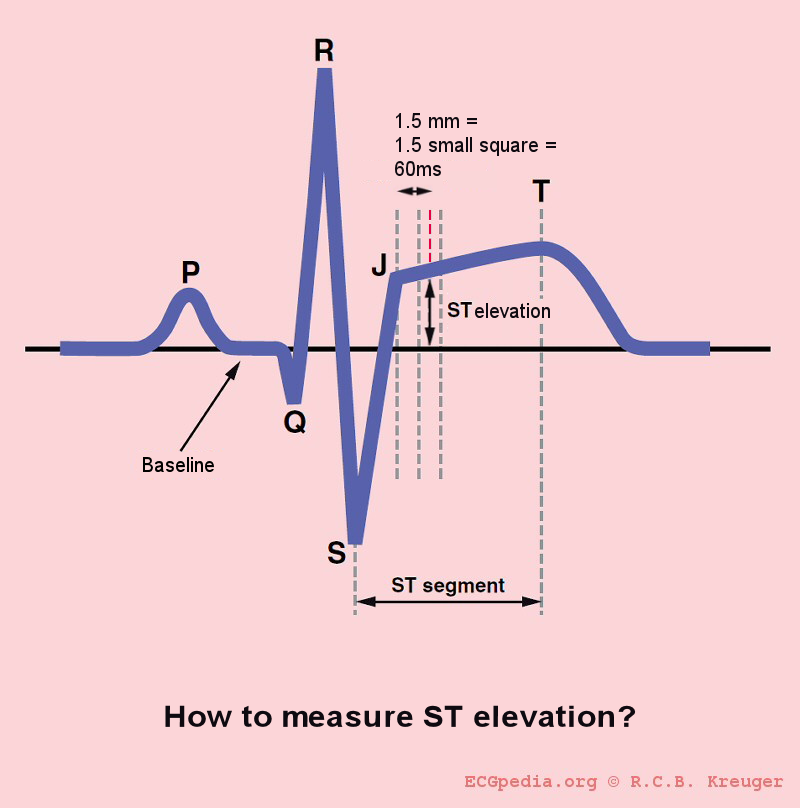
As the image below explains, ST elevation is measured 1.5 or 2mm (=60ms or 80ms) after the junctional or j-point. [2]

ST elevation
Please click HERE for more information on ST elevation. The most important cause of ST elevation is acute Ischemia. Other causes are [3][4]
- Acute pericarditis: ST elevation in all leads except aVR
- Pulmonary embolism: ST elevation in V1 and aVR
- Hypothermia: ST elevation in V3-V6, II, III and aVF
- Hypertrophic cardiomyopathy: V3-V5 (sometimes V6)
- High potassium (hyperkalemia): V1-V2 (V3)
- During acute neurologic events: all leads, primarily V1-V6
- Acute sympathic stress: all leads, especially V1-V6
- Brugada syndrome.
- Cardiac aneurysm.
- Cardiac contusion
- Left ventricular hypertrophy
- Idioventricular rhythm including Paced rhythm
ST depression
The most important cause of ST depression is Ischemia. Other causes of ST depression are:
- Reciprocal ST depression. If one leads whos ST elevation than usually the lead 'on the other site' shows ST depression. (this is mostly seen in ischemia as well.
- Left ventricular hypertophy with "strain" or depolarization abnormality
- Digoxin effect
- Low potassium / low magnesium
- Heart rate induced changes (post tachycardial)
- During acute neurologic events.
T wave changes
The T wave is quite 'labile' and longs lists of possible causes of T wave changes exist. A changing T wave can be a sign that 'something' is abnormal, but it doesn't say much about the severity. T waves can be peaked, normal, flat, or negative. Flat and negative T waves are defined as:
- flat T wave
- < 0.5 mm negative or positive T wave in leads I, II, V3, V4, V5 or V6
- negative T wave
- > 0.5 mm negative T wave in leads I, II, V3, V4, V5 or V6
A concise list of possible causes of T wave changes:
- Ischemia and myocardial infarction
- Pericarditis
- Myocarditis
- Cardiac contusion
- Acute neurologic events, such as a subarachnoid bleed.
- Mitral valve prolapse
- Digoxin effect
- Right and left ventricular hypertrophy with strain
Sources
Copyleft images obtained courtesy of ECGpedia, http://en.ecgpedia.org/index.php?title=Special:NewFiles&offset=&limit=500
References
- ↑ Braunwald, Eugene; Zipes, Douglas P. (2005). Braunwald's heart disease: a textbook of cardiovascular medicine. St. Louis, Mo: Elsevier Saunders. ISBN 0-8089-2305-6.
- ↑ Gibbons RJ, Balady GJ, Bricker JT, Chaitman BR, Fletcher GF, Froelicher VF; et al. (2002). "ACC/AHA 2002 guideline update for exercise testing: summary article: a report of the American College of Cardiology/American Heart Association Task Force on Practice Guidelines (Committee to Update the 1997 Exercise Testing Guidelines)". Circulation. 106 (14): 1883–92. PMID 12356646.
- ↑ Wang K, Asinger RW, Marriott HJ (2003). "ST-segment elevation in conditions other than acute myocardial infarction". N Engl J Med. 349 (22): 2128–35. doi:10.1056/NEJMra022580. PMID 14645641.
- ↑ Van de Werf F, Ardissino D, Betriu A, Cokkinos DV, Falk E, Fox KA; et al. (2003). "Management of acute myocardial infarction in patients presenting with ST-segment elevation. The Task Force on the Management of Acute Myocardial Infarction of the European Society of Cardiology". Eur Heart J. 24 (1): 28–66. PMID 12559937.