Hepatocellular adenoma other imaging findings: Difference between revisions
(Created page with "{{Hepatocellular adenoma}} {{CMG}} ==Overview== ==References== {{reflist|2}} Category:Disease Category:Types of cancer Category:Oncology [[Category:Gastroenter...") |
No edit summary |
||
| Line 1: | Line 1: | ||
{{Hepatocellular adenoma}} | {{Hepatocellular adenoma}} | ||
{{CMG}} | {{CMG}}; {{AOEIC}} {{CZ}} | ||
==Overview== | ==Overview== | ||
==Nuclear Scintigraphy=== | |||
* Compared with normal liver, adenomas usually show absent or decreased uptake of Tc-99m sulfur colloid, reflecting the decreased number or function of Kupffer cells. | |||
[http://www.radswiki.net Images courtesy of RadsWiki] | |||
<gallery perRow="3"> | |||
Image:Hepatic ademona CT 001.jpg|CT portal venous phase: A patient with multiple adenoma | |||
Image:Hepatic ademona CT 002.jpg|CT portal venous phase: A patient with multiple adenoma | |||
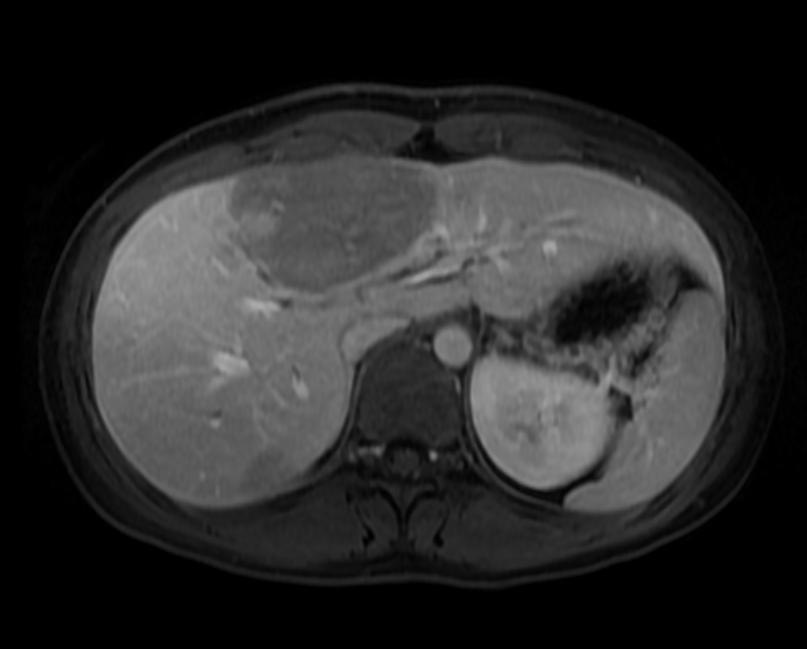
Image:Hepatic ademona MRI 003.jpg|T2 SSFSE: A patient with multiple adenoma | |||
Image:Hepatic ademona MRI 004.jpg|T2 SSFSE: A patient with multiple adenoma | |||
Image:Hepatic ademona MRI 005.jpg|T2 Fat sat: A patient with multiple adenoma | |||
Image:Hepatic ademona MRI 006.jpg|In phase: A patient with multiple adenoma | |||
Image:Hepatic ademona MRI 007.jpg|Out of phase: A patient with multiple adenoma | |||
Image:Hepatic ademona MRI 008.jpg|T1 fat sat: A patient with multiple adenoma | |||
Image:Hepatic ademona MRI 009.jpg|T1 fat sat arterial: A patient with multiple adenoma | |||
Image:Hepatic ademona MRI 010.jpg|T1 fat sat arterial: A patient with multiple adenoma | |||
Image:Hepatic ademona MRI 011.jpg|T1 fat sat delayed: A patient with multiple adenoma | |||
Image:Hepatic ademona MRI 012.jpg|T1 fat sat delayed: A patient with multiple adenoma | |||
</gallery> | |||
==References== | ==References== | ||
Revision as of 19:27, 21 January 2012
|
Hepatocellular adenoma Microchapters |
|
Diagnosis |
|---|
|
Treatment |
|
Case Studies |
|
Hepatocellular adenoma other imaging findings On the Web |
|
American Roentgen Ray Society Images of Hepatocellular adenoma other imaging findings |
|
Risk calculators and risk factors for Hepatocellular adenoma other imaging findings |
Editor-In-Chief: C. Michael Gibson, M.S., M.D. [1]; Associate Editor(s)-In-Chief: Cafer Zorkun, M.D., Ph.D. [2]
Overview
Nuclear Scintigraphy=
- Compared with normal liver, adenomas usually show absent or decreased uptake of Tc-99m sulfur colloid, reflecting the decreased number or function of Kupffer cells.
-

CT portal venous phase: A patient with multiple adenoma
-

CT portal venous phase: A patient with multiple adenoma
-

T2 SSFSE: A patient with multiple adenoma
-

T2 SSFSE: A patient with multiple adenoma
-
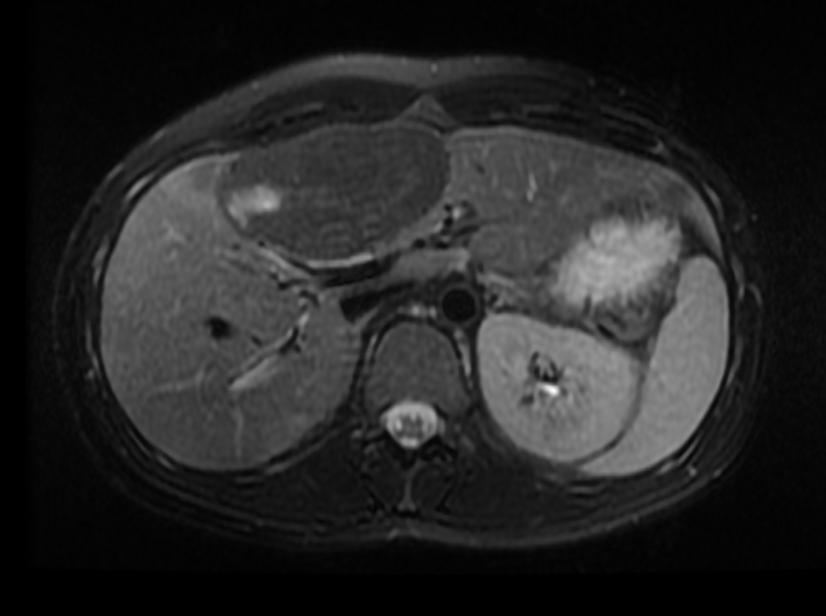
T2 Fat sat: A patient with multiple adenoma
-
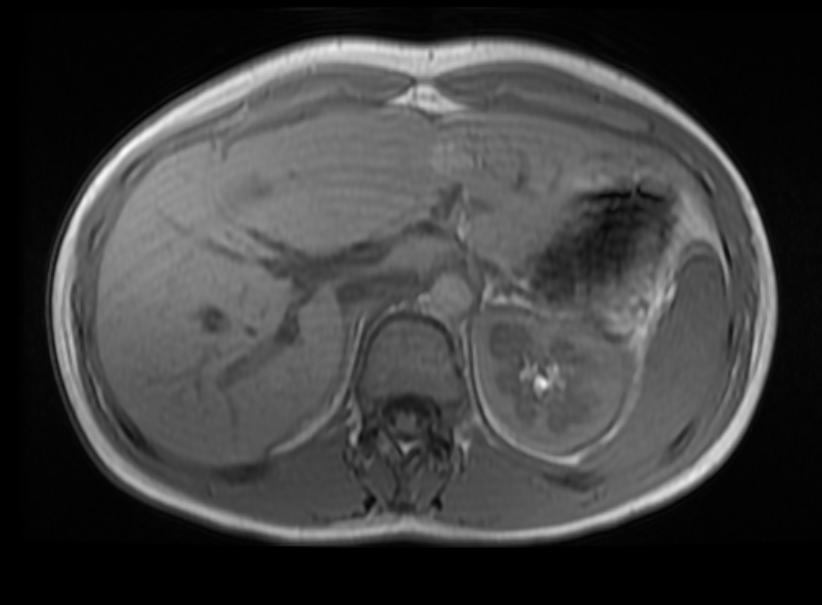
In phase: A patient with multiple adenoma
-

Out of phase: A patient with multiple adenoma
-

T1 fat sat: A patient with multiple adenoma
-

T1 fat sat arterial: A patient with multiple adenoma
-

T1 fat sat arterial: A patient with multiple adenoma
-
T1 fat sat delayed: A patient with multiple adenoma
-

T1 fat sat delayed: A patient with multiple adenoma


