Wiggers diagram

Red = aortic pressure
Blue = left ventricular pressure
Yellow = left atrial pressure.
|
WikiDoc Resources for Wiggers diagram |
|
Articles |
|---|
|
Most recent articles on Wiggers diagram Most cited articles on Wiggers diagram |
|
Media |
|
Powerpoint slides on Wiggers diagram |
|
Evidence Based Medicine |
|
Clinical Trials |
|
Ongoing Trials on Wiggers diagram at Clinical Trials.gov Trial results on Wiggers diagram Clinical Trials on Wiggers diagram at Google
|
|
Guidelines / Policies / Govt |
|
US National Guidelines Clearinghouse on Wiggers diagram NICE Guidance on Wiggers diagram
|
|
Books |
|
News |
|
Commentary |
|
Definitions |
|
Patient Resources / Community |
|
Patient resources on Wiggers diagram Discussion groups on Wiggers diagram Patient Handouts on Wiggers diagram Directions to Hospitals Treating Wiggers diagram Risk calculators and risk factors for Wiggers diagram
|
|
Healthcare Provider Resources |
|
Causes & Risk Factors for Wiggers diagram |
|
Continuing Medical Education (CME) |
|
International |
|
|
|
Business |
|
Experimental / Informatics |
Editor-In-Chief: C. Michael Gibson, M.S., M.D. [1]
A Wiggers diagram is a standard diagram used in cardiac physiology.
The X axis is used to plot time, while the Y axis contains all of the following on a single grid:
- Blood pressure
- Aortic pressure
- Ventricular pressure
- Atrial pressure
- Ventricular volume
- Electrocardiogram
- Arterial flow (optional)
- Heart sounds (optional)
By illustrating the coordinated variation of these values, it becomes easier to illustrate the relationship between these values in the cardiac cycle.
Etymology
It is named after Carl J. Wiggers. (The diagram is frequently incorrectly called a "Wigger's diagram". Although "Wiggers' diagram" would be grammatically correct, it is more frequently rendered "Wiggers diagram", with no apostrophe.)
Events
| Phase | EKG | Heart sounds | Aortic valve | Mitral valve | |
| A | Atrial systole | P | S4* | closed | open |
| B | Ventricular systole - Isovolumetric/isovolumic contraction | QRS | S1 ("lub") | closed | closed |
| C1 | Ventricular systole - Ejection 1 | - | open | closed | |
| C2 | Ventricular systole - Ejection 2 | T | open | closed | |
| D | Ventricular diastole - Isovolumetric/isovolumic relaxation | - | S2 ("dub") | closed | closed |
| E1 | Ventricular diastole - Ventricular filling 1 | - | S3* | closed | open |
| E2 | Ventricular diastole - Ventricular filling 2 | - | closed | open |
Note that during isovolumetric/isovolumic contraction and relaxation, all the heart valves are closed. At no time are all the heart valves open.
- S3 and S4 heart sounds are associated with pathologies and are not routinely heard.
Additional images
-
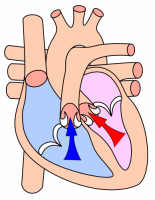
Ventricular systole
-
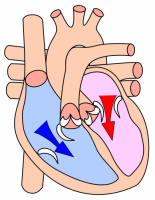
Cardiac diastole
-
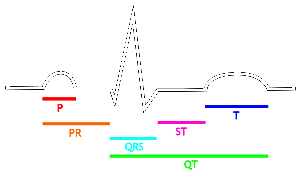
The EKG complex. P=P wave, PR=PR interval, QRS=QRS complex, QT=QT interval, ST=ST segment, T=T wave


See also
External links
- Flash animation at utah.edu
- Diagram at mmi.mcgill.ca
- Slides at ouhscphysio.org
- Diagram at arizona.edu
- Diagram at cals.ncsu.edu
- Biography of Carl Wiggers
- Template:EMedicineDictionary